
Figures & data
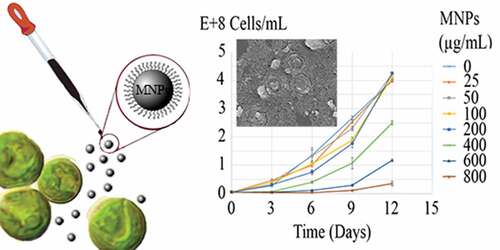
Figure 1. Characterization of manufactured nanoparticles, FT-IR spectra of MNPs (a1) and L-lysine (a2), XRD pattern of MNPs indicating characteristic pattern of magnetite crystals (b), VSM diagram of the MNPs indicating superparamagnetic property (c), and DSC curve of MNPs indicating nanoparticles oxidation at 195.1°C and L-lys decomposition a 384.3°C (d)
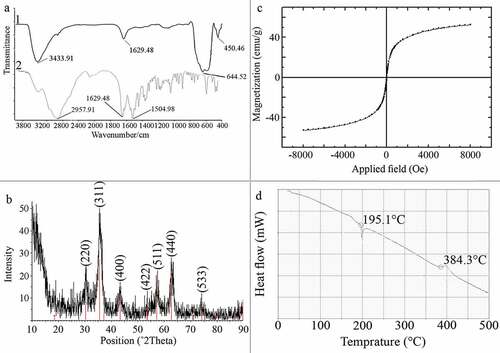
Figure 2. TEM Micrograph of the MNPs (a) and corresponding particle size distribution histogram (b)
Figure 3. SEM micrographs of C. vulgaris (a) and MNPs treated cells (b)
Figure 4. Microscopic appearance of the C. vulgaris cells exposed to various concentrations of MNPs (a: 0, b: 25, c: 50, d: 100, e: 200, f: 400, g: 600, and h: 800 µg/mL), increase in nanoparticles concentration resulted in the cells agglomeration
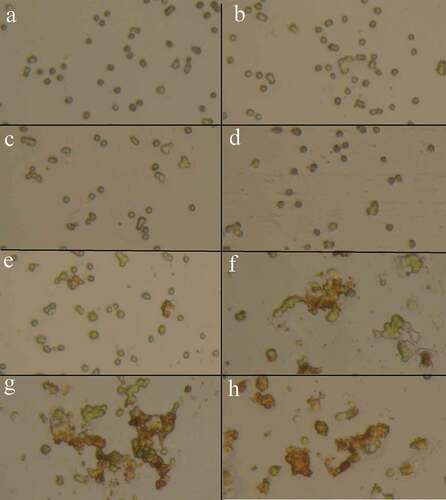
Figure 5. Growth curves of C. vulgaris cells at various concentrations of MNPs
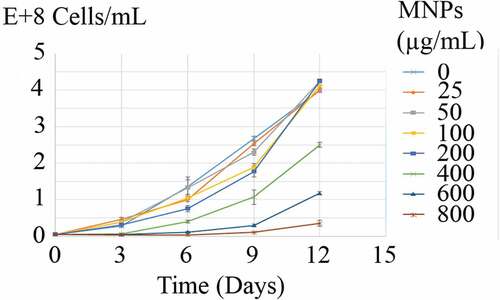
Figure 6. Growth inhibitory effects (I%) of MNPs on C. vulgaris cells over 12 days exposure
Figure 7. Cell pellet (a) and microscopic appearance (c) of C. vulgaris cells in contrast to MTT treated cells (b and d)
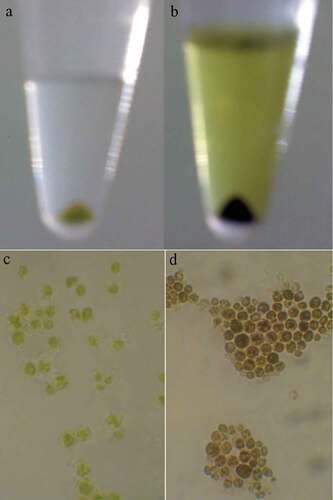
Figure 8. Mitochondrial activity (M %) of C. vulgaris cells exposed to various concentrations of MNPs for 12 days
Figure 9. Chlorophyll a content (a), and Chlorophyll b content (b) of C. vulgaris cells exposed to various concentrations of MNPs
Figure 10. Carotenoids content of C. vulgaris cells exposed to various concentrations of MNPs
Figure 11. Lipid content of C. vulgaris cells exposed to various concentrations of MNPs
Figure 12. Released protein from C. vulgaris cells exposed to various concentrations of MNPs
Highlights
Impacts of magnetic nanoparticles on the C. vulgaris cells were investigated.
Growth inhibitory effect was seen at concentrations ≥400 µg/mL.
Significant effects on chloroplast and mitochondrial activity occurred at ≥50 µg/mL.
Microalgal cells could overcome the imposed damages after certain days.
Data Availability Statement
Data available on request from the authors.