Figures & data
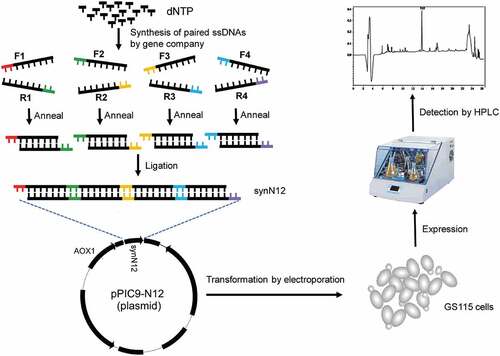
Table 1. Sequences of long oligos for synthesizing full coding sequence of CGA-N12
Figure 1. Design of coding sequence of chromogranin A-derived peptide CGA-N12 with four copies. Yellow highlight color showed processing sites of Kex2 and Ste13 proteases. Red letters showed the difference of codon between native sequence and optimized sequence
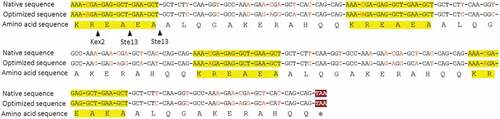
Figure 2. Synthesis of synN12 and construction of expression vector pPIC9-N12. a) Schematic diagram of synthesizing full coding sequence of CGA-N12. b) Construct of expression vector pPIC9-N12. c) Identification of expression vector pPIC9-N12 digesting by restriction enzymes
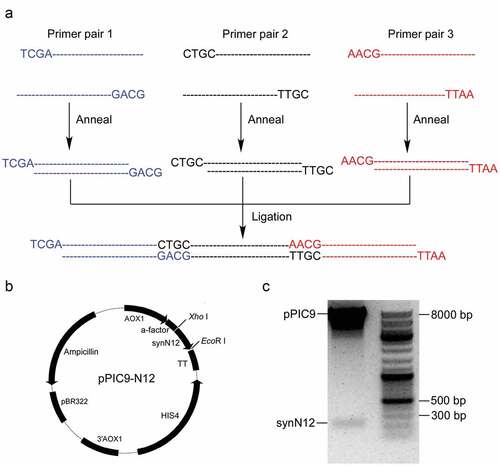
Figure 3. The toxicity of CGA-N12 toward Pichia pastoris and analysis of transformants by genomic PCR. a) The inhibition zone test to check the toxicity of CGA-N12 toward Pichia pastoris. b) PCR analysis of transformants. Plasmid pPIC9-N12 (lane 5) or GS115 genomic DNA (lane 6) as template were employed as controls. #1, #2, and #3 represented three different transformants using in this study
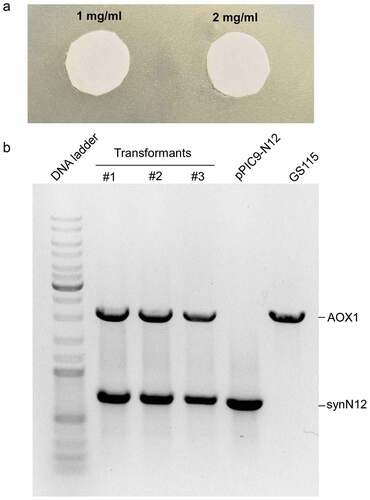
Figure 4. Expression of recombinant CGA-N12 in Pichia pastoris. a) HPLC analysis of fermentation supernatant culturing in BMMY medium. b) HPLC analysis of fermentation supernatant culturing in BMM medium. c) HPLC analysis of synthetic CGA-N12 peptide used as the internal standard. Synthetic CGA-N12 peptide was added into BMM medium to reach the concentration of 1 mg/mL, and 60 μL of the sample was loaded into HPLC column for separation