Figures & data
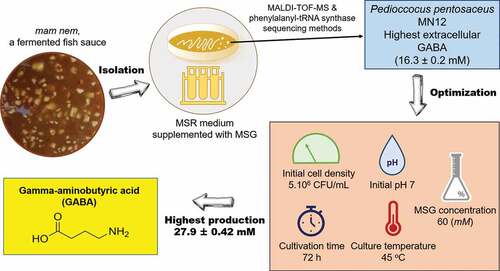
Figure 1. GABA-producing capability of different LAB isolates from mam nem. Cells were grown with initial cell density of 107 CFU/mL in MRS broth supplemented with 60 mM of MSG for 24 h at 37°C. Concentration of GABA in culture supernatants were quantified by an HPLC method. Data are means ± SD of GABA production from triplicate experiments. Bars without a common letter differ significantly (P < 0.05)
Figure 2. Effect of initial cell density on the GABA production of P. pentosaceus MN12. Cells were grown in MRS broth supplemented with 60 mM of MSG at 37°C for 24 h. Concentration of GABA in culture supernatants were quantified by an HPLC method. Data are means ± SD of GABA production from triplicate experiments. Bars without a common letter differ significantly (P < 0.05)
Figure 3. Effect of monosodium glutamate (MSG) concentration on the GABA production of P. pentosaceus MN12. Cells were grown in MRS broth with initial cell density of 5.106 CFU/mL at 37°C for 24 h. Concentration of GABA in culture supernatants were quantified by an HPLC method. Data are means ± SD of GABA production from triplicate experiments. Bars without a common letter differ significantly (P < 0.05)
Figure 4. Effect of initial pH on the GABA production of P. pentosaceus MN12. Cells were grown in MRS broth with initial cell density of 5.106 CFU/mL at 37°C for 24 h. Concentration of GABA in culture supernatants were quantified by an HPLC method. Data are means ± SD of GABA production from triplicate experiments. Bars without a common letter differ significantly (P < 0.05)
Figure 5. Effect of temperature on the GABA production from P. pentosaceus MN12. Cells were grown in MRS broth with initial cell density of 5.106 CFU/mL at initial pH 7 for 24 h. Concentration of GABA in culture supernatants were quantified by an HPLC method. Data are means ± SD of GABA production from triplicate experiments. Bars without a common letter differ significantly (P < 0.05)
Figure 6. Effect of fermentation time on pH (a), cell growth (b) and GABA accumulation (c) by P. pentosaceus MN12. Cells were grown in MRS broth in optimal conditions for 120 h. The measurements of pH, cell growth and GABA content were taken at 24 h intervals. Data are means ± SD from triplicate experiments. Means without a common letter differ significantly (P < 0.05)