
Figures & data
Table 1. The specific information of DEGs
Figure 1. Heatmap and volcanic maps of differentially expressed MDGs from TCGA and ICGC data. (a and b) Differentially expressed MDGs obtained from the TCGA dataset. (c and d) Differentially expressed MDGs obtained from the ICGC dataset
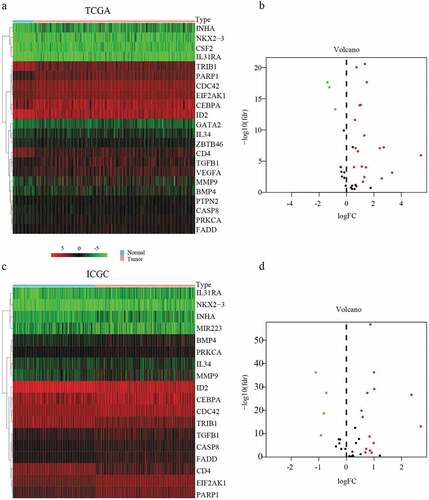
Figure 2. Venn diagram showing the intersecting differentially expressed MDGs from two public databases. Blue area: TCGA dataset; yellow area: ICGC dataset; cross area: differentially expressed MDGs expressed in both databases
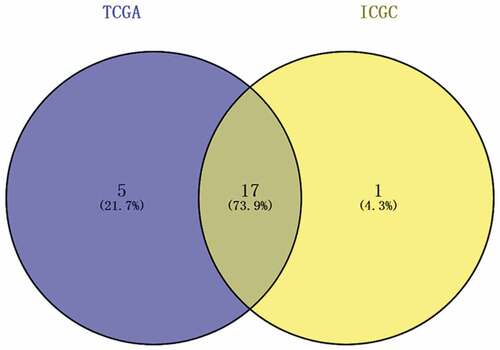
Figure 3. The expression of differentially expressed MDGs in HCC from TCGA and ICGC data. (a) The expression of differentially expressed MDGs in TCGA data. (b) The expression of differentially expressed MDGs in ICGC data
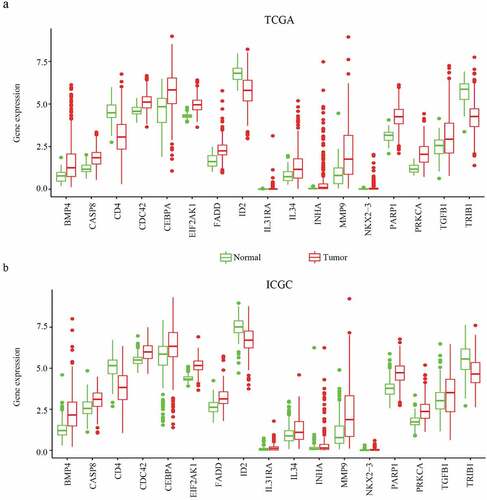
Figure 4. The relationship between MDG expression and the prognosis of HCC patients. (a–c) Kaplan-Meier estimated survival curves of CDC42, EIF2AK1 and MMP9 were constructed using TCGA clinical data. (d–f) Kaplan-Meier estimated survival curves of CDC42, EIF2AK1 and MMP9 were constructed using ICGC clinical data
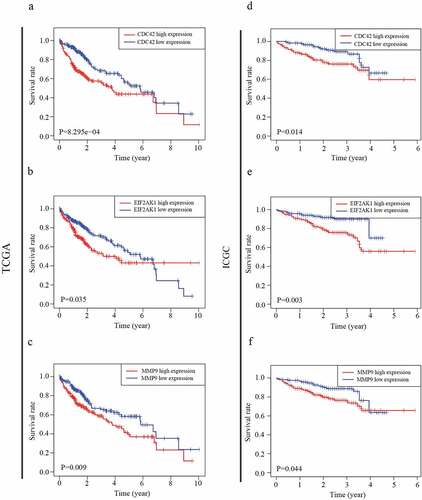
Figure 5. ROC analysis of the CDC42, EIF2AK1 and MMP9 signatures in HCC. (a) ROC analysis of the TCGA database. (b) ROC analysis of the ICGC database
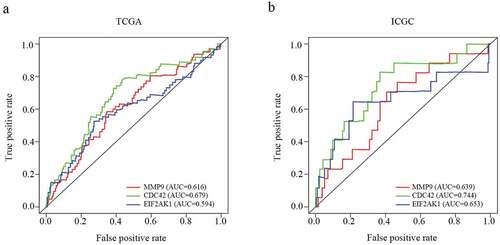
Table 2. Univariate and Multivariate analyses of factors associated with survival of patients with HCC in TCGA database and ICGC database
Figure 6. CDC42 expression is upregulated in primary HCC. (a) CDC42 expression in the Roessler liver dataset in Oncomine. (b) CDC42 expression in the Mas liver dataset in Oncomine. (c) CDC42 expression in the Wurmbach liver dataset in Oncomine

Figure 7. Immunohistochemistry confirmed the differential expression of CDC42. (a) The expression of CDC42 in normal tissue. (b) The expression of CDC42 in tumor tissue
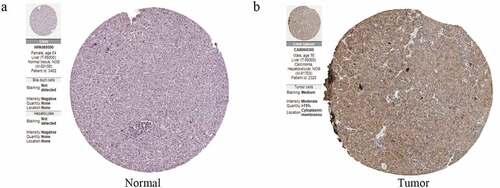
Figure 8. The immune infiltration levels of six immune cell types associated with CDC42 expression were analyzed based on the TIMER database. (a–f) CDC42 expression positively correlates with the infiltration of B cells (a), CD4 + T cells (b), CD8 + T cells (c), dendritic cells (d), macrophages (e), and neutrophils (f)
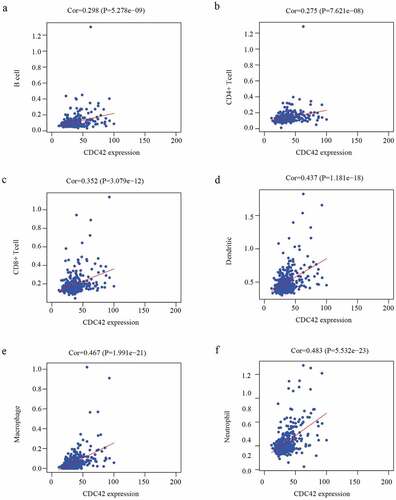
Figure 9. Correlation analyses between CDC42 expression and M2 macrophage markers. (a–d) The expression of CDC42 was significantly correlated with M2 macrophage markers (CD163, MMP2, MMP9, and STAT3) in the TCGA database. (e–h) The expression of CDC42 was significantly correlated with M2 macrophage markers (CD163, MMP2, MMP9, and STAT3) in the ICGC database
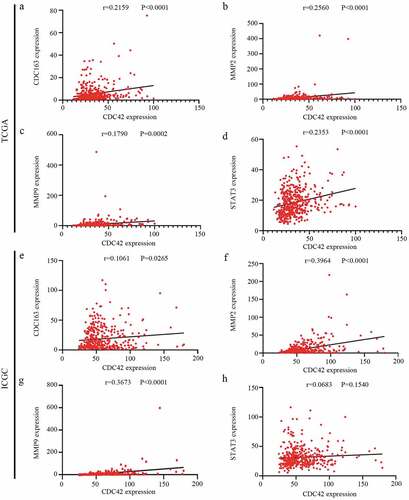
Figure 10. Correlation analyses between CDC42 expression and immune checkpoint inhibitors
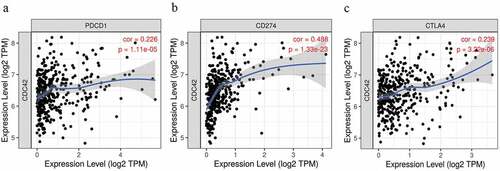
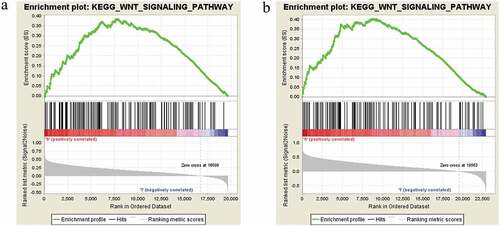
Figure 11. Enrichment plots from GSEA. (a) CDC42 expression positively correlated with the Wnt signaling pathway in the TCGA dataset. (b) CDC42 expression positively correlated with the Wnt signaling pathway in the ICGC dataset
Supplemental Material
Download ()Availability of data and materials
The datasets analyzed was acquired from The Cancer Genome Atlas (TCGA) database (https://portal.gdc.cancer.gov/) and ICGC database (https://dcc.icgc.org/).