Figures & data
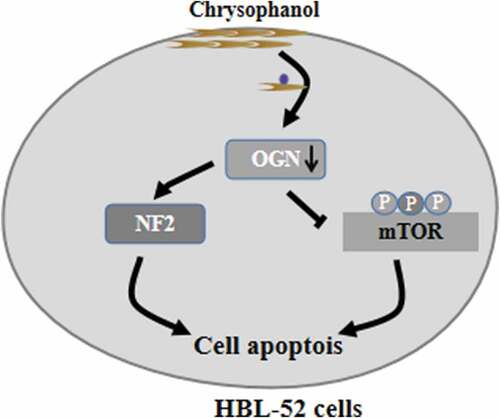
Figure 1. Chrysophanol (Chp) inhibits the growth of HBL-52 cells in vitro. Cells were treated with different concentrations of chrysophanol for the indicated periods, and (a) CCK8, (b) cell colony formation, and (c) bromodeoxyuridine (BrdU) assays were conducted. (d) The distribution of cells in different phases of the cell cycle was determined by flow cytometry after treatment with 60 μM chrysophanol for 48 h. *P< 0.05, compared with 0 μM chrysophanol group or control group
Figure 2. Chrysophanol (Chp) induces apoptosis of HBL-52 cells in vitro. Cells were treated with different concentrations of chrysophanol for 48 h. (a) Expression levels of caspase-3, caspase-9, Bax, and Bcl-2 were determined using western blot. (b) Densitometry of proteins from the experiments in panel A. (c) Activity of caspase-3 and −9. (d) Histone DNA levels. (e) Annexin V and propidium iodide staining, as captured by flow cytometry. *P< 0.05, compared with 0 μM chrysophanol
Figure 3. Chrysophanol (Chp) reduces OGN/mTOR signaling and activates NF2 signaling in HBL-52 cells in vitro. Cells were treated with different concentrations (0, 15, 30, 60, and 90 μM) of chrysophanol for 48 h. (a) Western blot of OGN, p-mTOR, total mTOR, and NF2. (b) Densitometry quantifying the relative levels in the experiments in panel A. *P< 0.05, compared with 0 μM chrysophanol
Figure 4. OGN induces activation of mTOR and down-regulates NF2 in HBL-52 cells in vitro. Cells were transfected for 48 h with plasmids (100 nM) overexpressing OGN mimics or inhibitors, then assayed. (a) Western blot of OGN, p-mTOR, and NF2. (b) Quantitation of the experiments in panel A. *P< 0.05, compared with 0 μM chrysophanol
Figure 5. Chrysophanol acts via OGN to alter mTOR and NF2 signaling and growth of HBL-52 in vitro. Cells were transfected with plasmids encoding OGN mimetic or inhibitor, then treated with 60 µM chrysophanol for 48 h. (a) Western blot of p-mTOR and NF2. (b) Densitometry of the experiments in panel A. (c) Cell viability was analyzed by CCK8 assay. (d) Proportions of cells in apoptosis based on flow cytometry. *P< 0.05, compared with control group; #P< 0.05, compared with chrysophanol group