
Figures & data
Figure 1. Flow chart illustrating the different stages in the manufacture of six teas
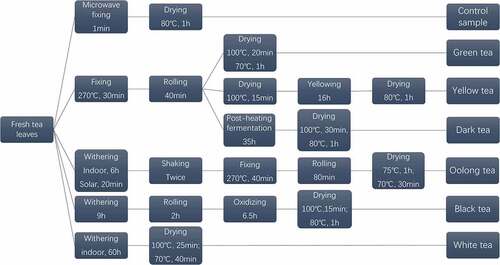
Table 1. The content (mg/g) of catechin components, caffeine, theaflavins, and total polyphenols in the control sample and six categories of teas
Table 2. Antioxidant activity and antioxidant capacity composite index (ACCI) of the control sample and six categories of teas in vitro
Figure 2. (a) Inhibition rate of PL by the control sample and six categories of teas. (b) Inhibition rate of HMG-COA reductase by the control sample and six categories of teas. (c) Inhibition rate of LCAT by the control sample and six categories of teas. (d) Inhibition rate of α-glucosidase by the control sample and six categories of teas. Values were expressed as mean ± standard deviation (n = 3). Similar letters represented no significant difference in the inhibition rate of each enzyme and vice versa (Duncan’s test, P < 0.05)
Table 3. Pearson’s correlation coefficients among bioactive components, antioxidant activity, inhibition rate of three lipid metabolism enzymes, and α-glucosidase inhibition rate