
Figures & data
Table 1. The number of mRNAs and lncRNAs in the 11 modules
Figure 1. (a) Scale independence and mean connectivity analysis for various soft threshold powers. (b) Clustering dendrograms of mRNAs. Different colors below indicate different co-expression modules
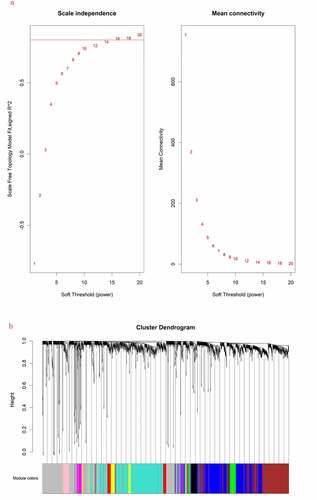
Figure 2. Module–trait relationship. Each row represents a module eigengene and each column represents a trait. Each cell includes the corresponding correlation and p value
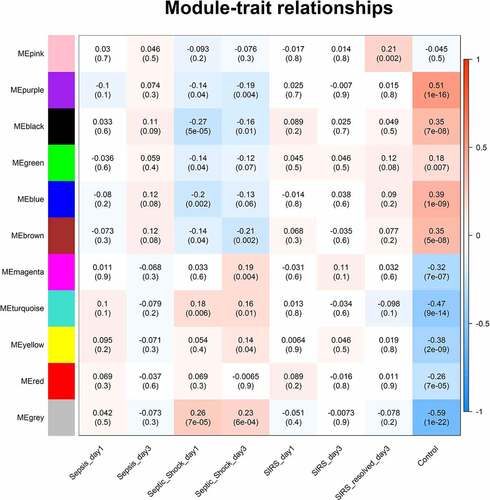
Figure 3. Enriched GO and KEGG pathway analysis of mRNAs in the turquoise module. The size of spots corresponds to the numbers of mRNAs, the color of spots represents p value
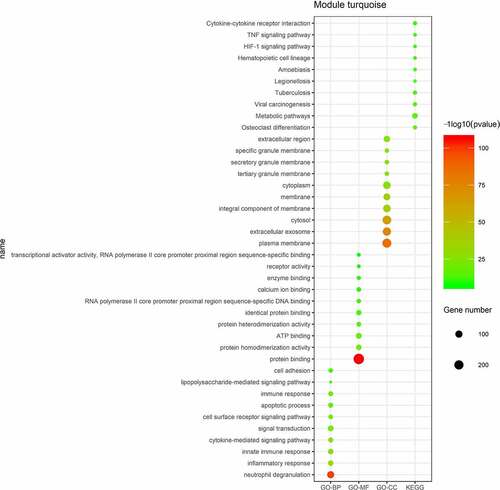
Figure 4. Co-expression mRNA-lncRNA network in the turquoise module. the circular nodes represent the mRNAs, triangle nodes represent lncRNAs. Blue edges represent mRNA-lncRNA interaction and gray edges represent mRNAs–mRNAs interaction
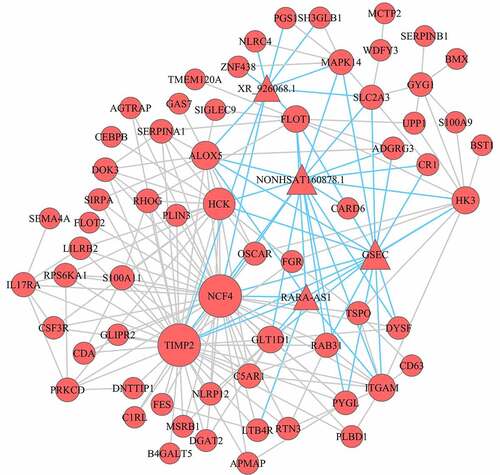
Figure 5. Co-expression mRNA-lncRNA-pathway of the turquoise module. The circular nodes represent the mRNAs, triangle nodes represent lncRNAs
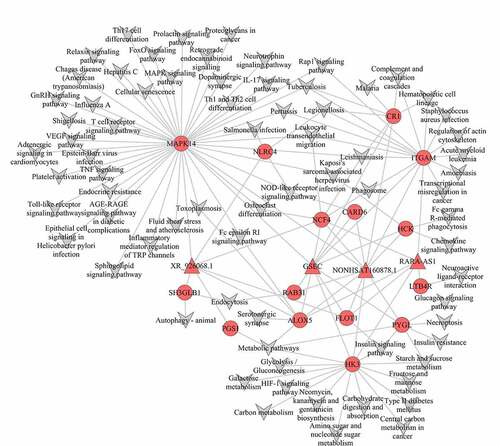
Figure 6. ROC curve of diagnosis of pediatric sepsis. the AUC of the fifteen mRNAs (ALOX5, CARD6, CR1, FLOT1, HCK, HK3, ITGAM, LTB4R, MAPK14, NCF4, NLRC4, PGS1, PYGL, RAB31, SH3GLB1) and four lncRNAs (GSEC, NONHSAT160878.1, RARA-AS1 and XR_926068.1) was all above 0.88 in diagnosis of pediatric sepsis
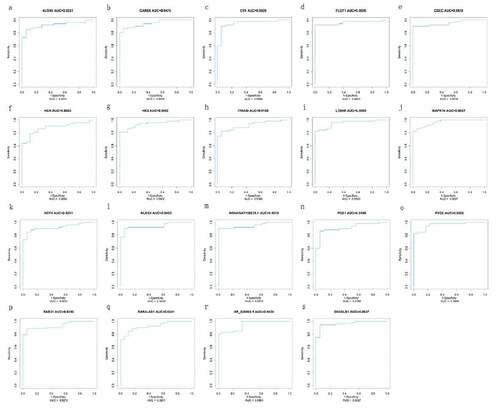
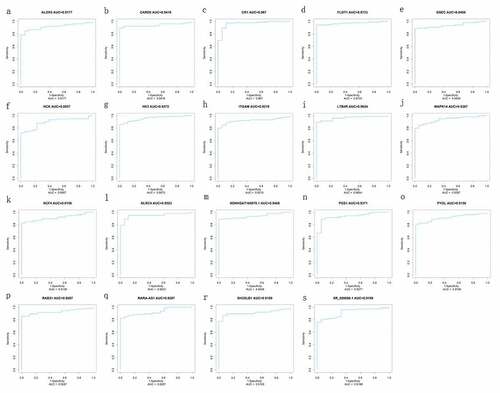
Figure 7. ROC curve of diagnosis of pediatric septic shock. the AUC of the fifteen mRNAs (ALOX5, CARD6, CR1, FLOT1, HCK, HK3, ITGAM, LTB4R, MAPK14, NCF4, NLRC4, PGS1, PYGL, RAB31, SH3GLB1) and four lncRNAs (GSEC, NONHSAT160878.1, RARA-AS1, and XR_926068.1) was all above 0.89 in diagnosis of pediatric septic shock
Supplemental Material
Download ()Availability of data and materials
The datasets during the current study are available in the GEO: https://www.ncbi.nlm.nih.gov/geo/query/acc.cgi?acc=GSE13904. Links to repositories for the annotation, visualization and integrated discovery are available at DAVID: http://david.abcc.ncifcrf.gov/.