
Figures & data
Figure 1. Inhibition of micro RNA miR-122-5p on lipopolysaccharide-induced myocardial injury. Wistar rats were intravenously injected with miR-122-5p antagomir, followed by lipopolysaccharide (LPS) stimulation (n = 6 rats per group). (a-b) After LPS treatment for 12 h, heart tissues were harvested for the relative expression levels of miR-122-5p and G-protein-coupled receptor kinase interacting protein-1 (GIT1) using real-time quantitative PCR (RT-qPCR) or western blot assay. (c) The ratio of heart weight/body weight (HW/BW) was calculated. (d) Hematein and eosin (H&E) staining revealed the effect of miR-122-5p on LPS-induced histopathological changes in heart. (e) Levels of cardiac troponin I (cTnI) and lactate dehydrogenase (LDH) were examined by enzyme-linked immunosorbent assay (ELISA). ***p < 0.001 versus control; ##p < 0.01, ###p < 0.001 versus LPS + NC antagomir
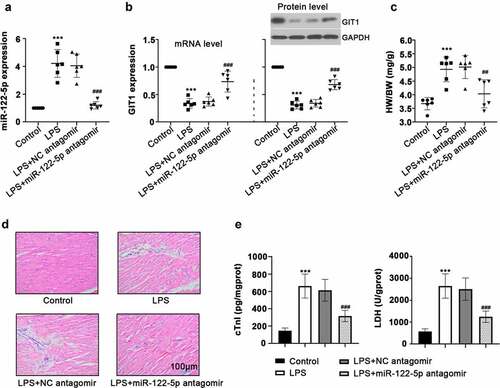
Figure 2. Inhibition of micro RNA miR-122-5p prevents myocardial injury in sepsis rats. (a) The production of reactive oxygen species (ROS) in the heart was determined using enzyme-linked immunosorbent assay (ELISA). (b) The activities of catalase (CAT), superoxide dismutase (SOD) and glutathione peroxidase (GSH-px), the key enzymes related to oxidative stress, were measured. (c) The release of inflammatory cytokines tumor necrosis factor alpha (TNF-α), interleukin-6 (IL-6) and IL-1β was analyzed by ELISA kits. (d) Hearts were sectioned for terminal deoxynucleotidyl transferase dUTP nick end labeling (TUNEL) analysis to visualize lipopolysaccharide (LPS)-triggered apoptosis. (e) Western blot was carried out for determining the expression of caspase-3, a protein associated with apoptosis. ***p < 0.001 versus control; ##p < 0.01, ###p < 0.001 versus LPS + NC antagomir
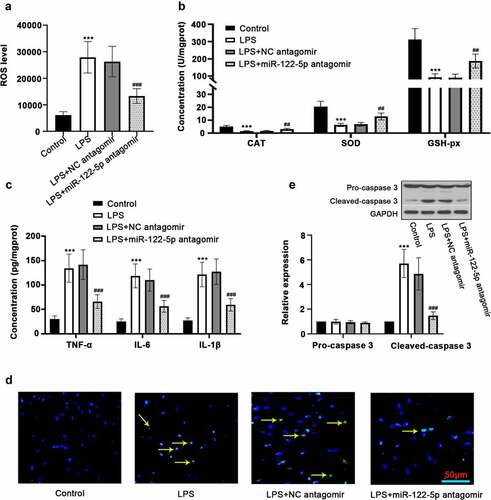
Figure 3. In vitro analysis for beneficial role of inhibiting micro RNA miR-122-5p in lipopolysaccharide (LPS)-induced apoptosis. (a-b) Rat H9c2 cells were treated with LPS for 12 h or 24 h, and the expression levels of miR-122-5p and G-protein-coupled receptor kinase interacting protein-1 (GIT1) were assessed by real-time quantitative PCR (RT-qPCR) or western blot analysis. (c-d) H9c2 cells were transfected with NC inhibitor or miR-122-5p inhibitor for 24 h, followed by LPS treatment for another 24 h under proper culture conditions. After that, miR-122-5p and GIT1 expression levels were measured. (e) The contents of cardiac troponin I (cTnI) and lactate dehydrogenase (LDH) were detected by appropriate kits. (f) Flow cytometry showed the apoptosis of LPS-stimulated myocardial cells. (g) Western blot analysis illustrated the changes of caspase-3 expression. **p < 0.01, ***p < 0.001 versus control; ++p < 0.01, +++p < 0.001 versus LPS + NC inhibitor
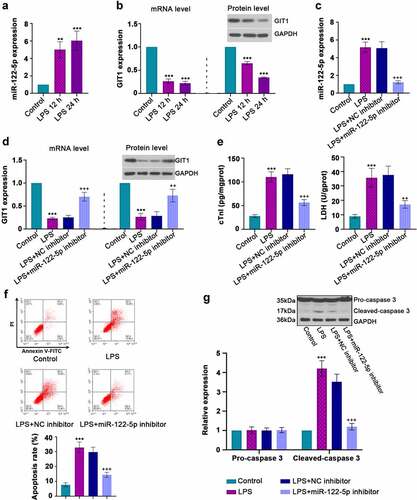
Figure 4. Inhibition of micro RNA miR-122-5p suppresses lipopolysaccharide (LPS)-induced oxidative stress and inflammatory response. (a) Reactive oxygen species (ROS) production was determined by a flow cytometer. (b) The enzymes catalase (CAT), superoxide dismutase (SOD), glutathione peroxidase (GSH-px) activities were measured using the manufacturer’s kits. (c) Western blot was performed to measure the nuclear factor erythroid 2-related factor 2 (Nrf-2) expression in the cytoplasm and nucleus. (d) Real-time quantitative PCR (RT-qPCR) was used for heme oxygenase-1 (HO-1) and NAD(p)H: quinone oxidoreductase 1 (NQO-1) levels. (e) The concentrations of tumor necrosis factor alpha (TNF-α), interleukin-6 (IL-6) and IL-1β were quantified by enzyme-linked immunosorbent assay (ELISA) kits. ***p < 0.001 versus control; +p < 0.05, ++p < 0.01, +++p < 0.001 versus LPS + NC inhibitor
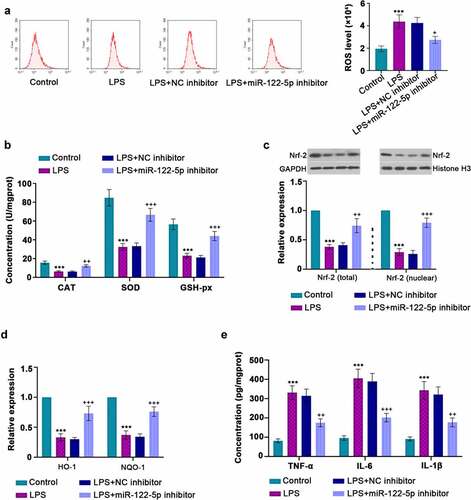
Figure 5. Potential downstream target gene of micro RNA miR-122-5p. H9c2 cells were transfected with NC mimics, miR-122-5p mimics, NC inhibitor and miR-122-5p inhibitor for 48 h. (a-b) The expression levels of miR-122-5p and G-protein-coupled receptor kinase interacting protein-1 (GIT1) were verified by real-time quantitative PCR (RT-qPCR) assay. (c) The predicted binding sites of miR-122-5p in the 3ʹ-UTR of GIT1, and the sequence information of miR-122-5p and GIT1 (wild- or mutant- type) was displayed. (d) Luciferase assay verified the correlation between miR-122-5p and GIT1. aap < 0.01, aaap < 0.001 versus NC mimics; bbbp < 0.001 versus NC inhibitor; ddp < 0.01 versus NC mimics + GIT1 3ʹUTR (WT)
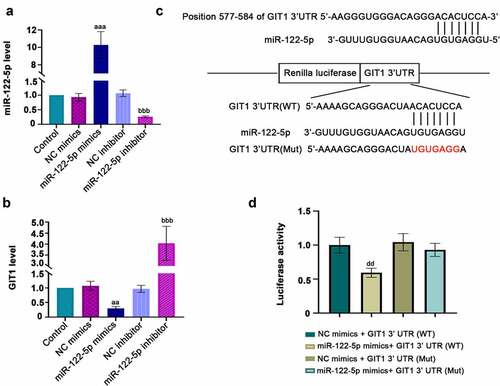
Figure 6. G-protein-coupled receptor kinase interacting protein-1 (GIT1) deficiency attenuates the effects of micro RNA miR-122-5p loss on myocardial injury. (a) H9c2 cells were transfected with GIT1 siRNA to downregulate GIT1 expression. (b) The cells were transfected with GIT1 siRNA and/or miR-122-5p inhibitor, and then induced by lipopolysaccharide (LPS). GIT1 expression at mRNA and protein levels was then measured using real-time quantitative PCR (RT-qPCR) or western blot. (c) Apoptosis of myocardial cells was analyzed by flow cytometry. (d) Reactive oxygen species (ROS) production was examined using flow cytometry. (e-g) The contents of lactate dehydrogenase (LDH), superoxide dismutase (SOD) and tumor necrosis factor alpha (TNF-α) were assessed by the enzyme-linked immunosorbent assay (ELISA) kits. XXXp < 0.001 versus NC siRNA; ^p < 0.05, ^^p < 0.01, ^^^p < 0.001 versus LPS + miR-122-5p inhibitor + NC siRNA
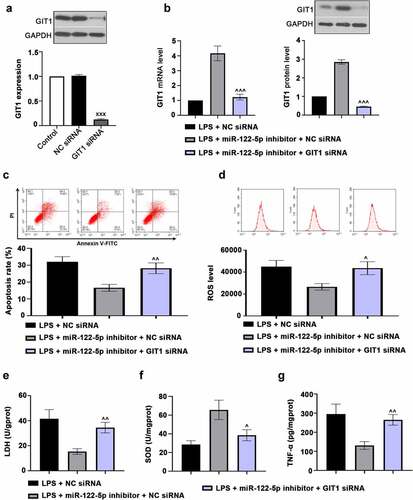
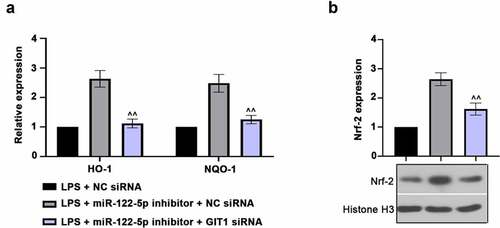
Figure 7. G-protein-coupled receptor kinase interacting protein-1 (GIT1) deficiency inhibits nuclear factor erythroid 2-related factor 2 (Nrf-2) activation. (a) Real-time quantitative PCR (RT-qPCR) assay was used to measure the heme oxygenase-1 (HO-1) and NAD(p)H: quinone oxidoreductase 1 (NQO-1) expression. (b) Nuclear Nrf-2 level was revealed using western blot analysis. ^^p < 0.01 versus LPS + miR-122-5p inhibitor + NC siRNA
Supplemental Material
Download ()Data availability statement
The datasets generated during and/or analyzed during this study are available from the corresponding author on reasonable request.