
Figures & data
Figure 1. Down-regulation of miR-126 expression in brain tissue of CLP rats
Brain tissues were collected from each group of rats, and the expression of miR-126 in the tissues was detected by qRT-PCR. ***P < 0.001.
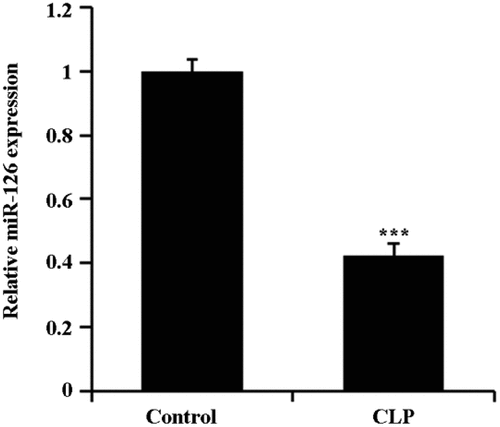
Figure 2. Neurobehavioral scores of rats in different treatment groups
The rats in each group were neurobehaviorally assessed after 24 h of treatment. *P < 0.05 vs. control group, ** P < 0.01 and ***P < 0.001; #P < 0.05 vs. CLP + miR-NC group; &P < 0.05 vs. CLP + miR-126 + PMA group, &&P < 0.01; $P < 0.05 vs. CLP group.
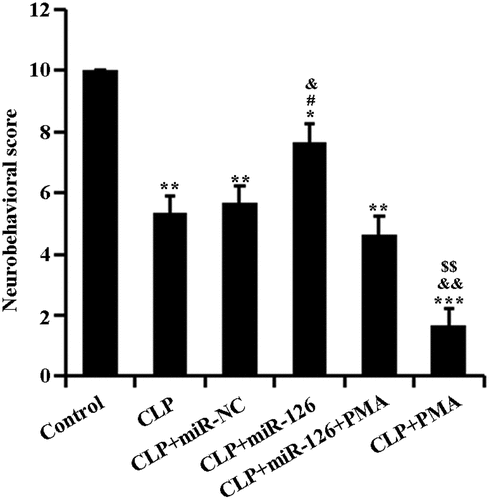
Figure 3. Water content and EB extravasation in brain tissue of rats in different treatment groups
A. Determination of water content in brain tissue of rats in each group by dry-wet specific gravity method; B. Evans blue extravasation method to detect blood-brain barrier permeability C. Western blot to detect the expression of claudin-5 and occludin proteins in rats of each group. *P < 0.05, **P < 0.01 vs. control group; #P < 0.05 vs. CLP + miR-NC group; &P < 0.05, &&P < 0.01 vs. CLP + miR-126 + PMA group; $P < 0.05, $$ P < 0.01 vs. CLP group.
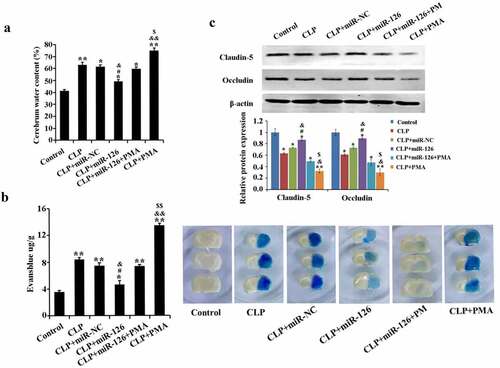
Figure 4. Levels of TNF-α, IL-6, IL-1β and IL-10 in the serum of rats in different treatment groups
Serum was collected from each group of rats. A. Detection of TNF-α expression in rats of each group by ELISA; B. Detection of IL-1β expression in rats of each group by ELISA; C. Detection of IL-10 expression in rats of each group by ELISA; D. Expression of IL-6 in rats of each group was detected by ELISA. *P < 0.05, ** P < 0.01 and ***P < 0.001 vs. control group; # P < 0.05, ##P < 0.01 vs. CLP + miR-NC group; &P < 0.05, &&P < 0.01 vs. CLP + miR-126 + PMA group; $P < 0.05 vs. CLP group.
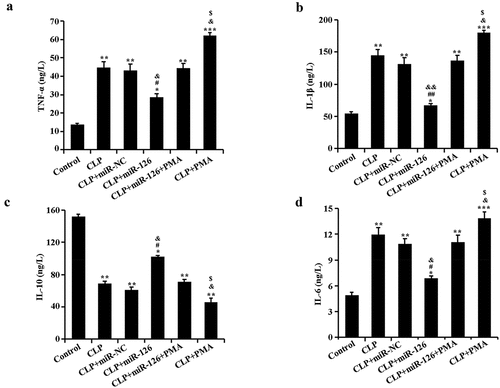
Figure 5. Activities of CAT, SOD and MDA in brain tissue of rats in different treatment groups
A. Detection of CAT activity in rats of each group by ELISA; B. Detection of SOD activity in rats of each group by ELISA; C. The activity of MDA in rats of each group was detected by ELISA. *P < 0.05, **P < 0.01, ***P < 0.001 vs. control group; #P < 0.05 vs. CLP + miR-NC group; &P < 0.05 vs. CLP + miR-126 + PMA group; $P < 0.05 vs. CLP group.
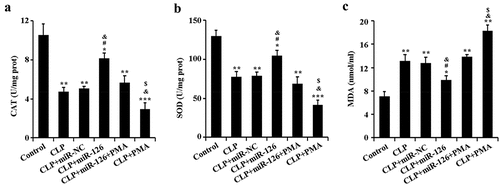
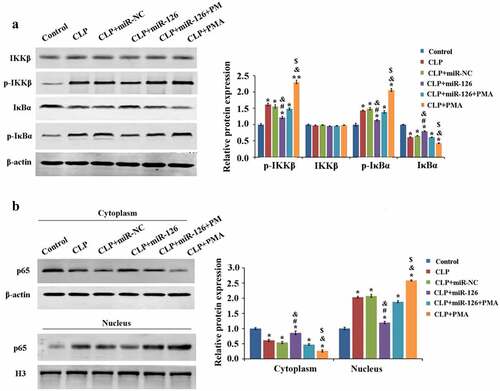
Figure 6. Effects of different treatments on blood-brain barrier related proteins and NF-κB signaling pathway in rat brain tissue
A. Western blot was used to detect the expressions of IKKβ, IκBα, p-IKKβ and p-IκBα in rats of each group; B. Western blot was used to detect the expression of p65 in the nucleus and cytoplasm of rat brain tissue in each group. *P < 0.05, **P < 0.01 vs. control group; #P < 0.05 vs. CLP + miR-NC group; &P < 0.05 vs. CLP + miR-126 + PMA group; $P < 0.05 vs. CLP group.
Data Availability Statement:
Not Applicable