
Figures & data
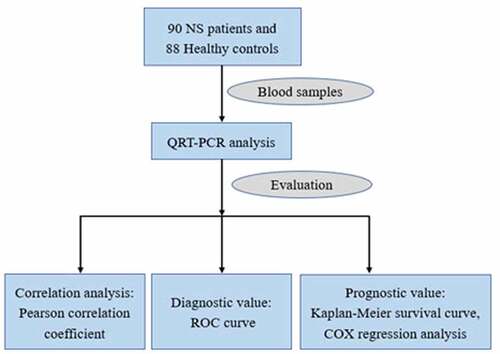
Table 1. Clinical data of the study population
Figure 1. The relative expression of miR-455-5p in NS patients. *** P < 0.001
Table 2. Correlation between miR-455-5p and clinical characteristics
Figure 2. The diagnostic value of miR-455-5p was assessed by the ROC curve analysis. the AUC was 0.895, with the sensitivity of 80.2% and the specificity of 85.2%
Table 3. Multivariate Cox analysis of clinical characteristics in relation to overall survival
Figure 3. Kaplan-Meier survival curves of NS patients with different miR-455-5p expression levels
Data Availability Statement
The data that support the findings of this study are available from the corresponding author upon reasonable request.