
Figures & data
Figure 1. Cytotoxicity of Omarigliptin in human renal glomerular endothelial cells (HrGECs). (a). Molecular structure of Omarigliptin; (b). HrGECs were stimulated with 0, 1, 2, 10, 20, 100, and 200 μM Omarigliptin for 24 hours. Cell viability was assessed (*, **, P < 0.05, 0.01 vs. vehicle)
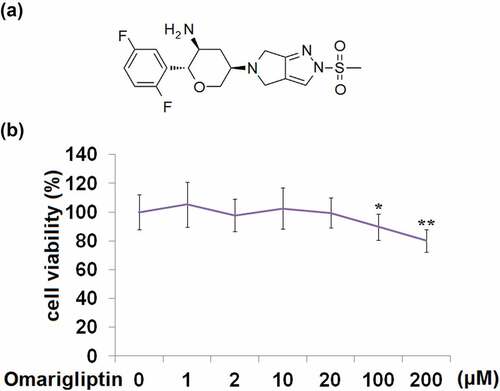
Figure 2. Omarigliptin ameliorated high glucose (HG)-induced cytotoxicity in HrGECs. Cells were challenged with HG and 10, and 20 μM Omarigliptin for 24 hours. (a). Morphology of HrGECs; (b). Cell viability; (c). LDH release (**, ***, P < 0.01, 0.005 vs. vehicle; #, ##, ###, P < 0.05, 0.01, 0.005 vs. HG)
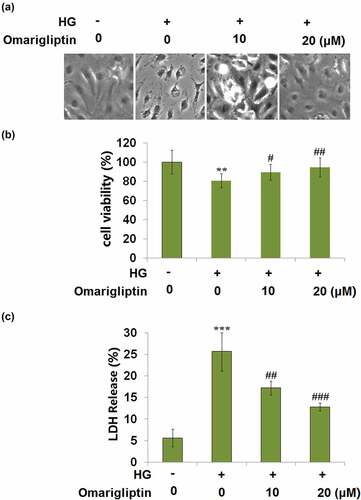
Figure 3. Omarigliptin mitigated high glucose (HG)-induced NOX-2 expression and mitochondrial ROS production in HrGECs. (a). NOX-2 mRNA; (b). NOX-2 protein; (c). mitochondrial ROS production (**, ***, P < 0.01, 0.005 vs. vehicle; #, ##, ###, P < 0.05, 0.01, 0.005 vs. HG)
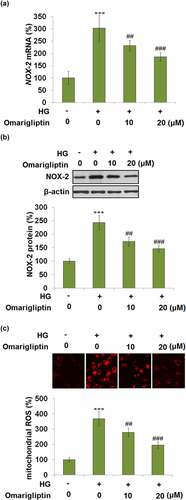
Figure 4. Omarigliptin alleviated high glucose-induced NLRP3 inflammasome activation. (a). NLRP3 and ASC mRNA; (b). NLRP3 and ASC protein (***, P < 0.005 vs. vehicle; ##, ###, P < 0.01, 0.005 vs. HG)
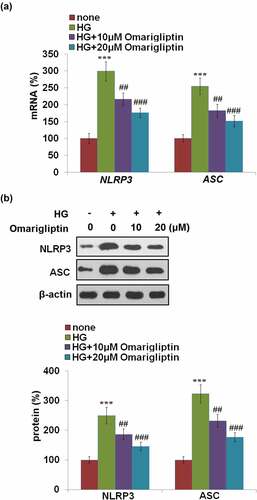
Figure 5. Omarigliptin inhibited high glucose-induced expressions of IL-18 and IL-1β. (a). Secretion of IL-18; (b). Secretion of IL-1β; (c). Protein levels of IL-18 and IL-1β as measured by western blot (***, P < 0.005 vs. vehicle; ##, ###, P < 0.01, 0.005 vs. HG)
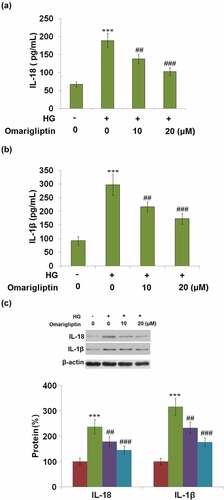
Figure 6. Omarigliptin restored high glucose-induced impairment of the AMPK/mTOR signaling pathway. Cells were challenged with high glucose (HG) and 20 μM Omarigliptin for 2 hours. The expression of p-AMPKα, AMPKα, and mTOR was measured (***, P < 0.005 vs. vehicle; ##, P < 0.01 vs. HG)
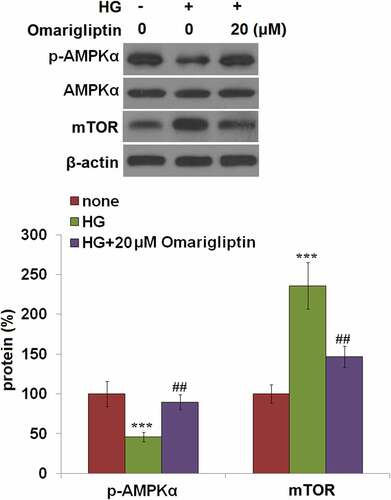
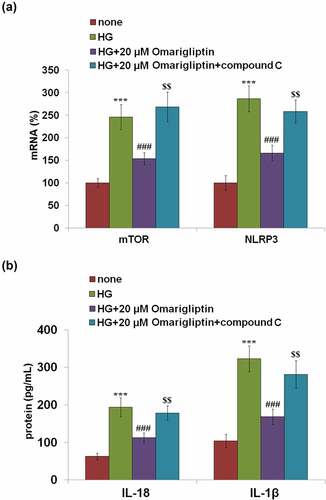
Figure 7. The protective effects of Omarigliptin against high glucose-induced NLRP3 inflammasome activation are mediated by AMPK. Cells were challenged with high glucose (HG) and 20 μM Omarigliptin or the AMPK inhibitor compound C for 24 hours. (a). The expression of mTOR and NLRP3; (b). Secretions of IL-18 and IL-1β as measured with ELISA (***, P < 0.005 vs. vehicle; ###, P < 0.005 vs. HG; $$, P < 0.01 vs. HG+ Omarigliptin)
Data availability statement
Data are available upon reasonable request to the corresponding author.