Figures & data
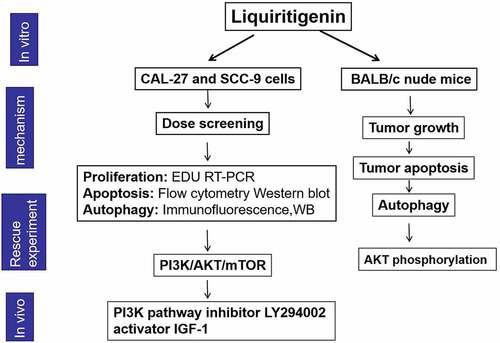
Figure 1. Liquiritigenin (LQ) suppresses cell proliferation in oral cancer cells. A. Chemical structure of Liquiritigenin (LQ). B-C. CAL-27 and SCC-9 cells were treated with a series of LQ ranging from 0–600 µM for cell viability detection through MTT assay. D. EDU staining was conducted to detect the proliferation of CAL-27 and SCC-9 cells. The nuclei of in proliferative and DNA replication state were red fluorescence. DAPI stained nuclei were blue fluorescence (scale: 50 μm). E. The statistical results of EDU positive cells (10 random fields were selected). F-G. Relative expression of Ki67 and PCNA was detected through qRT-PCR. *P < 0.05, **P < 0.01 VS LQ 0 µM group
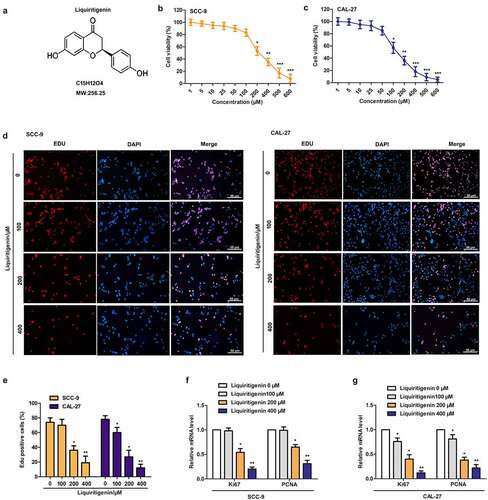
Figure 2. Liquiritigenin induces cell apoptosis in oral cancer cells. A. Effects of LQ on cell apoptosis were also valued through flow cytometry. B. Specific apoptosis rate comparison was also showed. C. Expression of cell apoptosis related proteins cleaved-caspase-3/caspase-3 and cleaved-caspase-9/caspase-9 was examined through western blot. *P < 0.05, **P < 0.01, ***P < 0.001 VS LQ 0 µM group
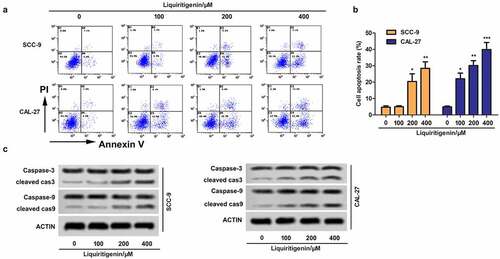
Table 1. Quantitative analysis about the expression of cleaved cas3/cas3 and cleaved cas9/cas9 detected by western blot in
Figure 3. Liquiritigenin induces obvious cell autophagy in oral cancer cells. A-B. Expressions of autophagy related LC3II/LC3I, ATG7 and Beclin1 in CAL-27 and SCC-9 cells were detected through western blot. C. LC3+ puncta were observed through immunofluorescence. Magnification: 200 × . D. Number of LC3+ puncta in cells in different groups was counted and showed. *P < 0.05, **P < 0.01, ***P < 0.001 VS LQ 0 µM group
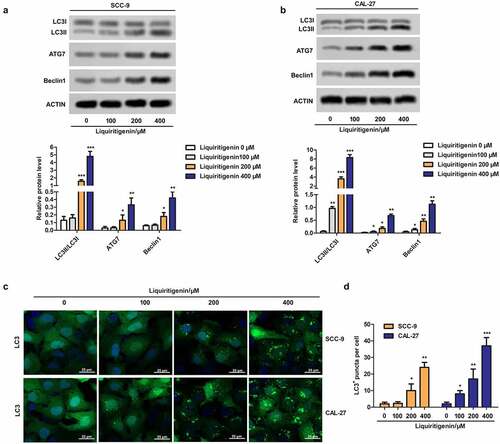
Figure 4. Liquiritigenin inactivates the PI3K/AKT/mTOR pathway in oral cancer cells. A-D. Expressions of PI3K/AKT/mTOR pathway related PI3K p85α/ total PI3K, p-AKT (Thr308)/total AKT and p-mTOR (S2448)/ total mTOR were detected through western blot in CAL-27 and SCC-9 cells. E. Immunofluorescence was conducted to observe the transport of AKT. Magnification: 200 × F. Statistical results showed the number of cells with AKT fluorescence in nucleus. G. PI3K pathway inhibitor LY294002 (4 μM) and pathway activator IGF-1(10 nM) were used to block or activate the PI3K/AKT/mTOR pathway. Expressions of related proteins were detected through western blot. H. Number of LC3+ puncta in cells in different groups was counted and showed. I. LC3 fluorescence in cells was observed through immunofluorescence. Magnification: 200 × J. Cell apoptosis was valued through flow cytometry. K. Specific apoptosis rate comparison was showed. A-F: *P < 0.05, **P < 0.01, ***P < 0.001 VS LQ 0 µM group. G-K: *P < 0.05, **P < 0.01, ***P < 0.001 VS control group
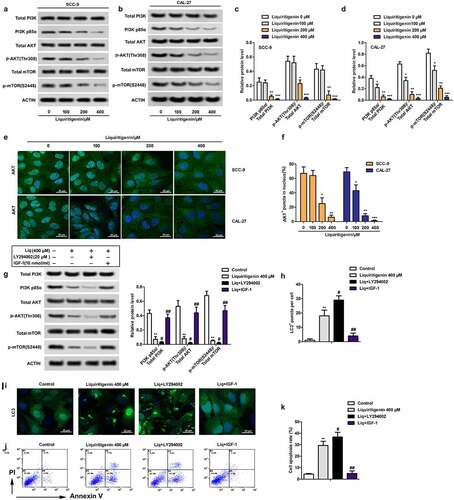
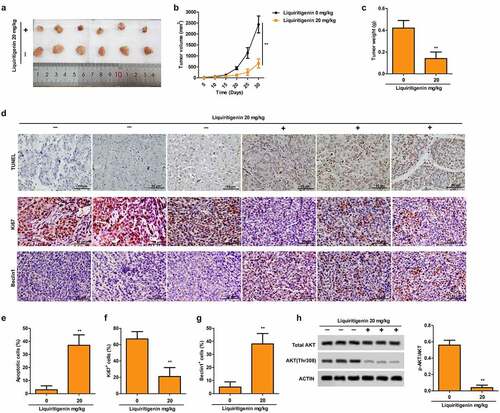
Figure 5. Liquiritigenin inhibits tumor growth, induces cell apoptosis and autophagy and inactivates the PI3K/AKT/mTOR pathway in vivo. Oral cancer xenograft model was established by injecting with CAL-27 cells. The mice in the experimental group received liquiritigenin 20 mg/kg/day through oral administration. A-C. Representative pictures (a) of tumor, tumor growth curve (b) and tumor weight (c) in each group were shown. D. TUNEL staining (upper) showed the proportion of apoptotic cells (scale: 50 μm). Expression of Ki67 (middle) and Beclin1 (lower) in tissues was valued through immunohistochemistry (scale: 50 μm). E-G. Statistical results about proportion of apoptotic cells, Ki67+ cells and Beclin1+ cells. H. Phosphorylation of AKT in tissues was also detected through western blot. **P < 0.01VS LQ 0 µM group