Figures & data
Table 1. Primers for qRT-PCR
Figure 1. Flow chart for analyzing RBPs in OCSCC
Figure 2. Heat map (a) and volcano plot (b) to show the differently expressed RBPs in OCSCC
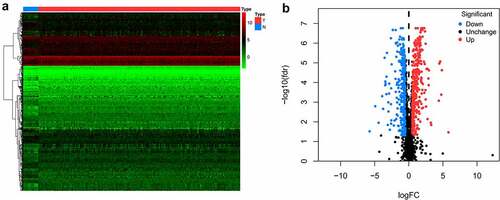
Table 2. RBPs associated with the prognosis of OCSCC in univariate Cox regression analysis
Figure 3. Construction of the prognostic model. (a, b) Lasso analysis identified 11 RBPs closely related to the prognosis of OCSCC. (c) Forest plot of the multiple Cox regression. Seven RBPs were determined as independent predictors for the prognosis of OCSCC
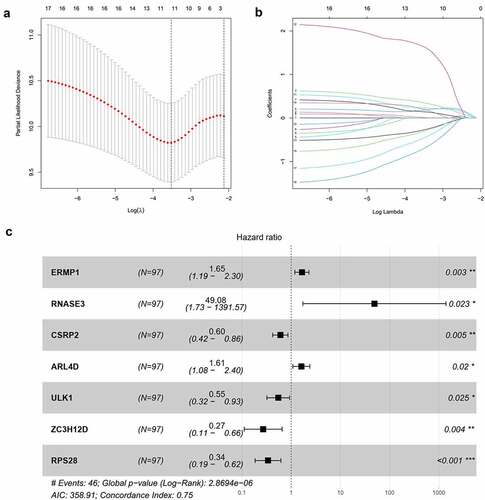
Figure 4. Survival analysis of TCGA training dataset. A. Dividing high and low risk group by median risk score; B. Survival time and status of OCSCC patients. C. Heatmap of the 7 significant RBPs expression. D. T-SNE analysis demonstrated that the patients in low and high risk groups were distributed in two directions. E. Survival curves showed noticeable stratification of high and low risk group
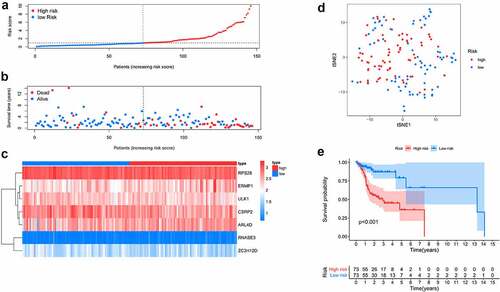
Figure 5. Predictive performance of the prognostic model in training dataset. A. ROC curves of the prognostic model in 1-, 3-, 5-year. B. ROC curves of the clinical risk factors and RBPs-related risk score for 1-year survival. C, D. Univariable and multiple Cox regression analysis involving clinical risk factors and the risk score
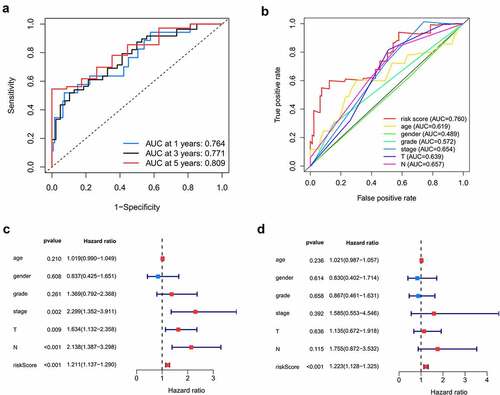
Figure 6. Internal and external validation of the prognostic model. A, B. The distribution of survival time, life status and the expression patterns of the 7 prognostic RBPs in TCGA internal testing dataset and GSE41613 testing dataset. C, D. Survival curves of high and low risk group showed noticeable stratification in two testing datasets. E, F. ROC curve of TCGA testing group and GSE41613 testing group in 1-, 3-, 5-year survival
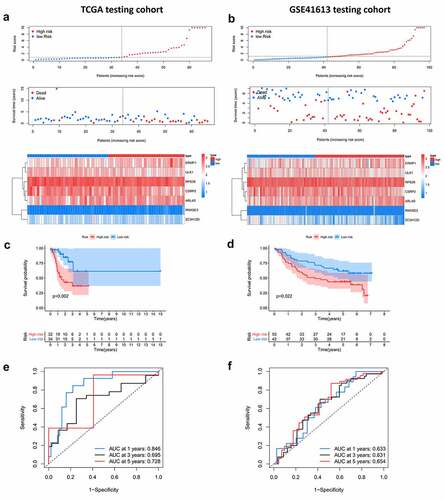
Figure 7. Nomogram to predict 1-, 3- and 5-year survival rate of OCSCC patients. A. Prognostic nomogram to predict survival of OCSCC patients based on TCGA dataset. B, C. The calibration plots for 1-, 3- and 5-year survival in TCGA training dataset (b) and testing dataset (c) demonstrated that the nomogram-predicted survival fit well with the actual survival
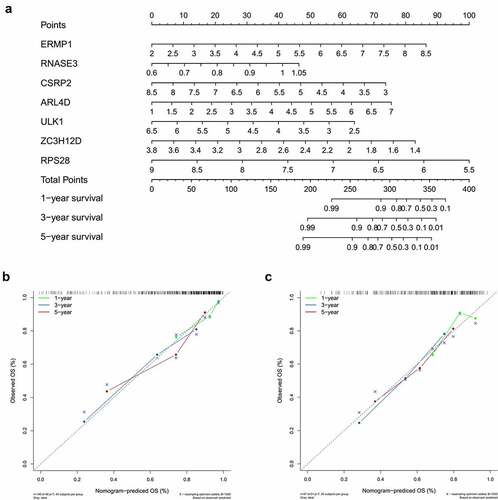
Figure 8. The mRNA expression level of seven prognostic genes in the normal oral keratinocyte cells (NOK) and OCSCC cells (CAL33). The expression of ERMP1, RNASE3, ARL4D were significantly upregulated in CAL33 than the control (NOK), while the expression of CSRP2, ULK, ZC3H12D, RPS28 were significantly downregulated in CAL33 compared with the NOK cells. *P < 0.05, **P < 0.01, ***P < 0.001
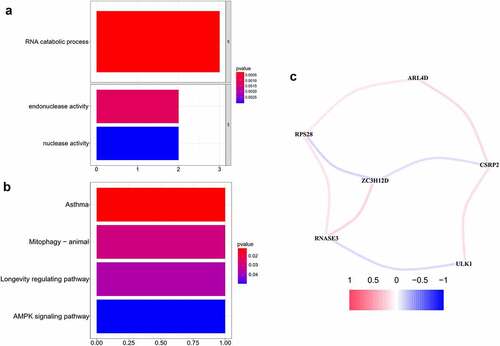
Figure 9. GO functional, KEGG pathway enrichment analysis and correlation network of the 7 prognostic RBPs. A, B. GO functional, KEGG pathway enrichment analysis. C. Correlation network of the 7 hub RBPs. The correlation coefficients were denoted by different colors