Figures & data
Figure 1. Structuring WGCNA. (a) Sample tree clustering and clinical traits (Survival days; vital: white = alive, red = dead, gray = missing value; KPS) heat map of 38 GBM tissues in older adults. (b) Scale independence of various soft-threshold values. (c) Mean connectivity of various soft-threshold values
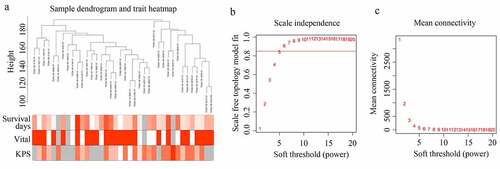
Table 1. Detail of hub genes in each significant module
Figure 2. Module clusters and relationships with clinical traits. (a) Clustering dendrograms of all genes with dissimilarity based on topological overlap, together with assigned module colors. (b) Identification of significant modules associated with clinical traits (survival days, vital, and KPS). Each cell in the heat map contains the corresponding correlation score and P-value. Red indicates a positive correlation, whereas green indicates a negative correlation
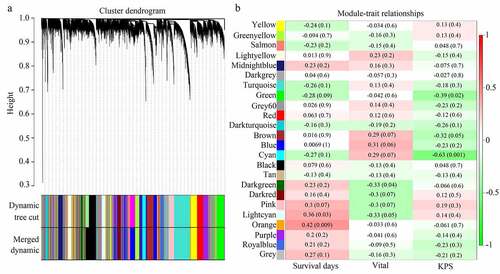
Figure 3. Relationship between gene significance (GS) and module membership (MM) in significant modules
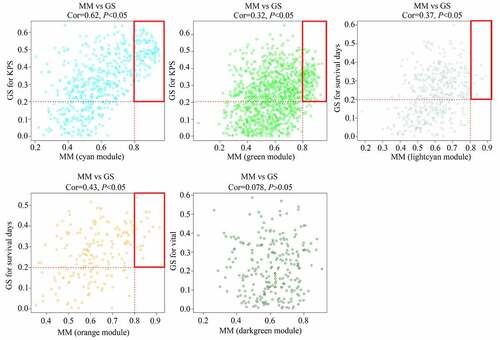
Figure 4. GO analysis for the module core genes
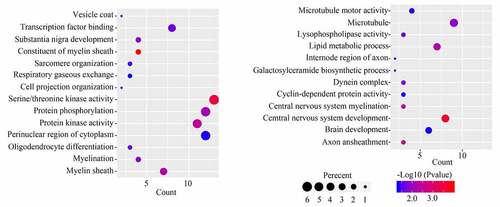
Figure 5. Selecting hub genes in GBM. (a) Module core genes used to construct protein-protein interaction network. Nodes indicate genes, lines indicate interactions. (b) Genes with top 10 degree score are shown
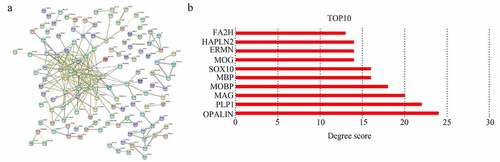
Figure 6. Relationship between the expression of hub genes and KPS score in older patients with GBM
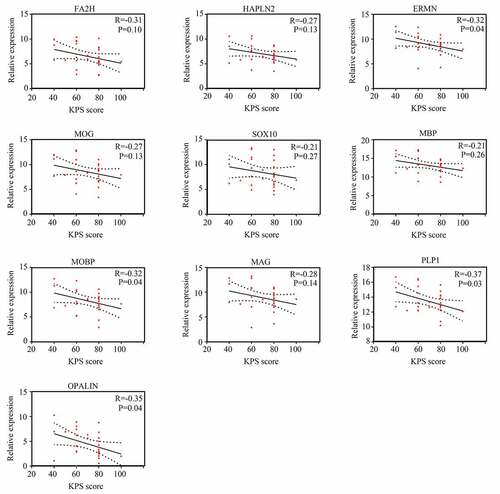
Figure 7. Relationship between the expression of hub genes and KPS score in young patients with GBM
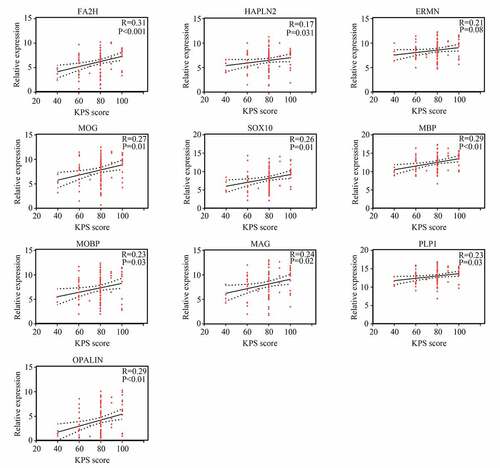
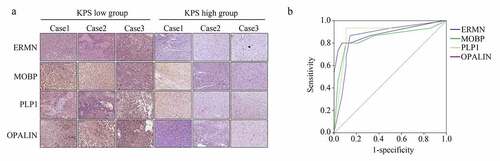
Table 2. Detail IHC score of ERMN, MOBP, PLP1 and OPALIN in GBM tissues provided by the elder patients with low KPS score and high KPS score
Figure 8. ERMN, MOBP, PLP1 and OPALIN were highly expressed in the GBM tissues provided by the older patients with lower KPS scores. (a) IHC stain determined the expression of ERMN, MOBP, PLP1 and OPALIN in GBM tissues provided by the older patients with low and high KPS scores. (b) ROC analysis was performed to determine the diagnostic value of ERMN, MOBP, PLP1 and OPALIN to distinguish the GBM tissues provided by the older patients with low and high KPS scores