
Figures & data
Figure 1. Decreased ROS levels in NSCLC spheres compared to that in NSCLC cells. (a) Images of spheres formed by NSCLC cells. (b) ROS level was measured in NSCLC spheres and parental cells. (c) Sphere size was evaluated in NSCLC spheres and cells with or without H2O2, and NAC treatment. (d) Sphere number was examined in NSCLC spheres and cells with or without H2O2, and NAC treatment. (e) ALDH1 activity was determined in NSCLC spheres and cells with or without H2O2, and NAC treatment. n ≥ 3, **P < 0.01 vs. Control, ##P < 0.01 vs. Cells
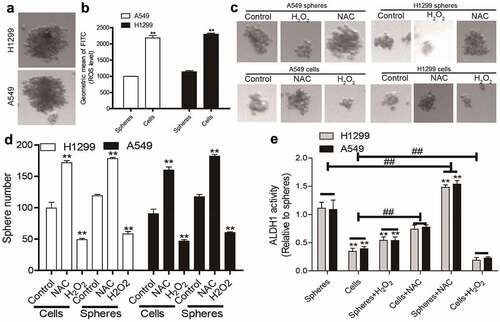
Figure 2. NSCLC spheres retain less respiratory capacity and mitochondrial content. (a) MMP level was examined in NSCLC spheres and cells. (b) MtDNA content was evaluated in NSCLC spheres and cells. (c) OCR was determined in H1299 spheres and cells. (d) OCR was measured in A549 spheres and cells. (e) NADP/NAD+ ratio was detected in NSCLC spheres and cells. (f) NADPH/NADP+ ratio was examined in NSCLC spheres and cells. (g) GSH/GSSG ratio was evaluated in NSCLC spheres and cells. n ≥ 3, **P < 0.01 vs. Control
Figure 3. ROS generation and mitochondrial biogenesis are suppressed by the acceleration of PGC1α degradation in NSCLC spheres. (a) LC3 protein level was determined in NSCLC spheres and cells. (b) PARKIN and PINK protein levels were detected in NSCLC spheres and cells. (c) PGC1α and PGC1β protein levels were examined in NSCLC spheres and cells. (d) TFAM mRNA level was measured in NSCLC spheres and cells. (e) TFAM mRNA level was detected in NSCLC cells with or without PGC1α knockdown. (f) ROS level was examined in NSCLC cells with or without PGC1α knockdown. (g) NADP/NAD+ ratio was detected in NSCLC cells with or without PGC1α knockdown. (h) NADPH/NADP+ ratio was examined in NSCLC cells with or without PGC1α knockdown. (i) GSH/GSSG ratio was evaluated in NSCLC cells with or without PGC1α knockdown. n ≥ 3, **P < 0.01 vs. Control
Figure 4. UBQLN1 suppresses PGC1α degradation in NSCLC cells. (a) PGC1α mRNA level was evaluated in NSCLC spheres and cells. (b) PGC1α protein stability was determined in NSCLC spheres and cells. (c) PGC1α protein was measured in NSCLC spheres treated with CHX as well as MG132 or not. (d) Co-IP analysis was performed to test the UBQLN1-PGC1α interaction. (e) PGC1α protein level was examined in NSCLC cells with or without UBQLN1 knockdown. (f) PGC1α protein was measured in A549 cells treated with CHX as well as MG132 or not. (g) PGC1α protein ubquitination level was detected in A549 cells with or without UBQLN1 knockdown. (h) ROS level was measured in NSCLC cells with UBQLN1 overexpression as well as PGC1α knockdown or not. (i) ROS level was examined in NSCLC cells with UBQLN1 knockdown as well as PGC1α overexpression or not. (j) TFAM mRNA level was determined in NSCLC cells with UBQLN1 overexpression as well as PGC1α knockdown or not. n ≥ 3, **P < 0.01 vs. Control, ##P < 0.01 vs. pc-UBQLN1+ NC or Si-UBQLN1+ Vector
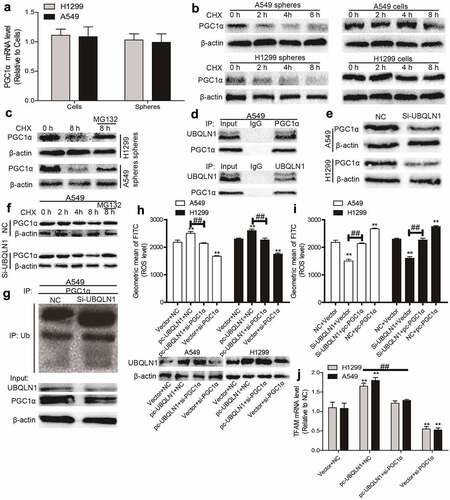
Figure 5. UBQLN1 is lowly expressed in NSCLC spheres and inhibits the CSC-like traits of NSCLC cells dependent on PGC1α. (a) UBQLN1 protein was detected in NSCLC spheres and cells. (b and c) CSC markers’ mRNA levels were measured in NSCLC cells with UBQLN1 knockdown as well as PGC1α overexpression or not. (d) CSC marker protein levels were determined in NSCLC cells with UBQLN1 knockdown as well as PGC1α overexpression or not. (e) ALDH1 activity was evaluated in NSCLC cells with UBQLN1 knockdown as well as PGC1α overexpression or not. (f and g) Sphere size and number were measured in NSCLC cells with UBQLN1 knockdown as well as PGC1α overexpression or not. n ≥ 3, **P < 0.01 vs. Control, ##P < 0.01 vs. Si-UBQLN1+ Vector
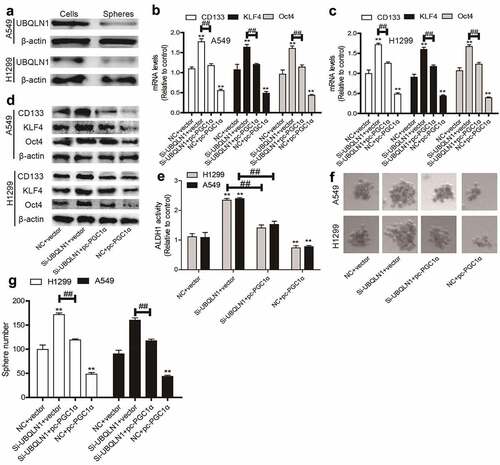
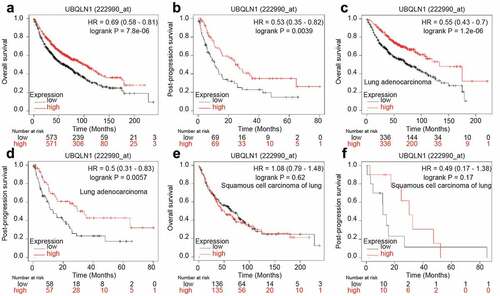
Figure 6. UBQLN1 predicts a longer survival in lung adenocarcinoma patients, but not squamous cell carcinoma of lung patients. (a) The correlation between UBQLN1 mRNA level and overall survival of lung cancer patients was evaluated through online dataset analysis. (b) The correlation between UBQLN1 mRNA level and post-progression survival of lung cancer patients was analyzed through online dataset analysis. (c and d) The correlation between UBQLN1 mRNA level and overall survival, post-progression survival of lung adenocarcinoma cancer patients was examined through online dataset analysis. (e and f) The correlation between UBQLN1 mRNA level and overall survival, post-progression survival of squamous cell carcinoma of lung patients was examined through online dataset analysis
Supplemental Material
Download ()Data Availability Statement
All data generated or analyzed during this study are included in this published article.