Figures & data
Figure 1. FLT1P1 knockdown promotes trophoblast cell proliferation and angiogenesis. (a) FLT1P1 expression in trophoblast cells transfected with sh-FLT1P1 or sh-NC was measured by RT-qPCR. (b) The proliferation of HTR8 and BeWo cells after FLT1P1 knockdown was detected by CCK-8 assay. (c) The angiogenesis in sh-FLT1P1-transfected HTR8 and BeWo cells was assessed by tube formation assay. (d) Western blot analysis was performed to measure the VEGFA, FGF2 and TGF-β protein levels in HTR8 and BeWo cells transfected with sh-FLT1P1 or sh-NC. *p < 0.05, ***p < 0.001
Figure 2. FLT1 knockdown promotes the proliferation and angiogenesis in trophoblast cells. (a) FLT1 expression in trophoblast cells transfected with sh-FLT1 or sh-NC was measured by RT-qPCR. (b) CCK-8 assay was performed to assess the proliferation in sh-FLT1-transfected HTR8 and BeWo cells. (c) The angiogenesis in HTR8 and BeWo cells after FLT1 knockdown was evaluated by tube formation assay. (d) The VEGFA, FGF2 and TGF-β protein levels in sh-FLT1-transfected HTR8 and BeWo cells were measured by western blot analysis. *p < 0.05, **p < 0.01, ***p < 0.001
Figure 3. The interaction between DKC1 and FLT1P1 (or FLT1). (a) The predicted RBP for FLT1P1 and FLT1 was obtained in starBase. (b) The prediction of the interaction probabilities of FLT1P1 or FLT1 with DKC1 by RPISeq (http://pridb.gdcb.iastate.edu/RPISeq/). Predictions with probabilities > 0.5 are considered ‘positive’, indicating that the corresponding RNA and protein are likely to interact. (c) The motif of DKC1 in FLT1P1 and FLT1. (d-e) The binding of DKC1 to FLT1P1 (or FLT1) was validated by RIP and RNA pull down assays. ***p < 0.001
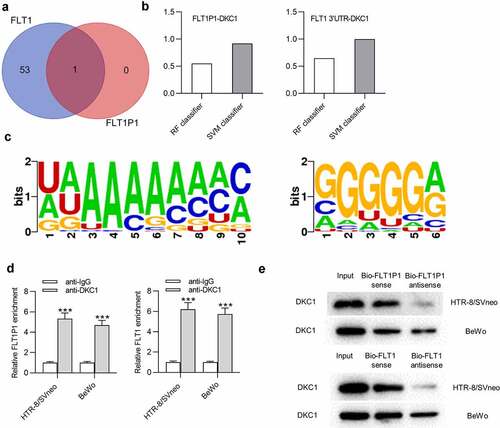
Figure 4. FLT1P1 increases FLT1 mRNA stability by recruiting DKC1. (a) FLT1 mRNA expression under actinomycin D treatment in the sh-FLT1P1 and sh-NC groups was measured by RT-qPCR. (b) The transfection efficiency of sh-DKC1 was assessed by RT-qPCR. (c) FLT1 mRNA expression under actinomycin D treatment in the sh-DKC1 and sh-NC groups was measured by RT-qPCR. (d) The FLT1 protein level in trophoblast cells transfected with sh-DKC1 was measured by western blot analysis. *p < 0.05, **p < 0.01, ***p < 0.001
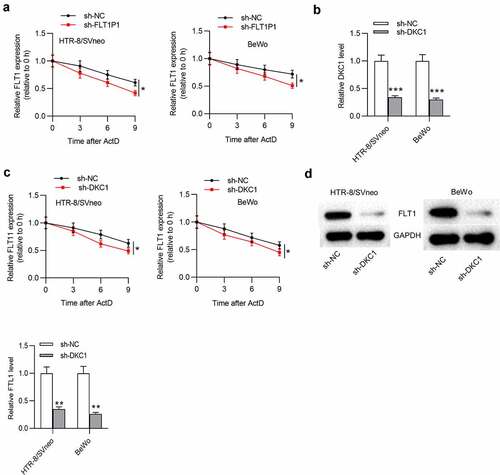
Figure 5. FLT1P1 increases FLT1 expression to regulate trophoblast cell proliferation and angiogenesis. (a) The overexpression efficiency of FLT1 was confirmed by RT-qPCR analysis. (b) The proliferative ability of trophoblast cells in each group was measured by CCK-8 assay. (c-d) Angiogenesis and angiogenesis-relevant protein levels were evaluated by tube formation assay and western blot analysis. *p < 0.05, **p < 0.01, ***p < 0.001