Figures & data
Table 1. The sequences of primers and oligonucleotides.
Figure 1. Identification of differentially expressed genes in lung tissues of LIRI rats versus the sham group. (a) Volcano plots of differentially expressed genes in the LIRI versus sham group. (b) Partial GO enrichment outcomes of differentially expressed genes in the LIRI versus sham group. (c) Partial KEGG enrichment outcomes of differentially expressed genes in the LIRI versus sham group. (d and e) The expression levels of YTHDF3 and IGF2BP2 were determined by RT-qPCR assay.
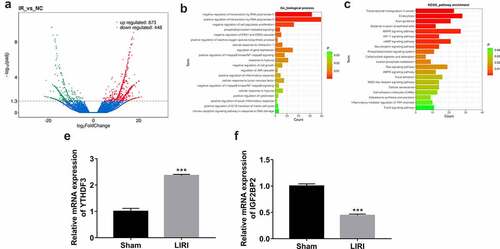
Figure 2. Establishment of an in vitro hypoxia/reoxygenation injury model in BEAS-2B cells. (a-d) BEAS-2B cells were exposed to hypoxic conditions for 0, 2, 4, 6, or 12 h, and then maintained in normoxic conditions (reoxygenation) for the same treatment time-period with hypoxia. (a) Cell viability was measured by CCK-8 assay. (b) Cell apoptotic rate was measured using flow cytometry. (c and d) The secretion levels of IL-1β and TNF-α were examined by ELISA assay.
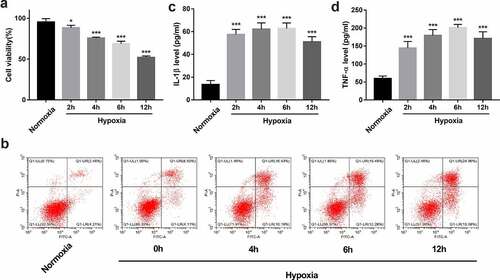
Figure 3. YTHDF3 or IGF2BP2 knockdown improved cell viability, facilitated cell cycle progression, hindered cell apoptosis, and inhibited IL-1β and TNF-α secretion in BEAS-2B cells treated with hypoxia/reoxygenation. (a) BEAS-2B cells in the H/R groups were transfected with or without si-NC, si-YTHDF3, or si-IGF2BP2 and then exposed to hypoxic conditions for 6 h and normoxic conditions for the remaining time. Cells prior to hypoxic treatment were named as the 0-h groups. Cell viability was examined by CCK-8 assay. (b-d) BEAS-2B cells were transfected with or without si-NC, si-YTHDF3, or si-IGF2BP2 for 48 h and then treated with normoxia or hypoxia/reoxygenation. Hypoxia//reoxygenation conditions: 6 h of exposure to hypoxic conditions (5% CO2, 94%N2, 1% O2) and another 6 h of normoxic (95% air, 5% CO2) treatment. (b) Cell apoptotic rate and cell cycle distribution patterns were measured using flow cytometry. (c and d) IL-1β and TNF-α secretion levels were determined by ELISA assay.
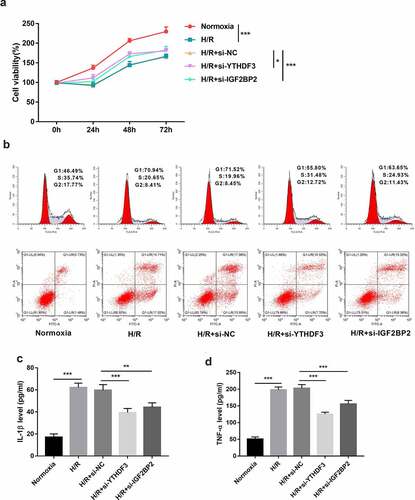
Figure 4. Identification of YTHDF3 and IGF2BP2 downstream regulatory pathways. (a) Identification of potential YTHDF3 targets. Sheet 1: m6a2target (http://m6a2target.canceromics.org/#/)-predicted protein-coding genes that could directly bind with YTHDF3. Sheet 2: Differentially expressed protein-coding genes after YTHDF3 knockdown in colorectal cancer cells. (b) The top 30 KEGG pathways enriched by the 87 potential YTHDF3 targets. (c) The top 30 biological processes enriched by the 87 potential YTHDF3 targets. (d) Identification of potential IGF2BP2 targets. List 1: Potential protein-coding genes with the probability to directly bind with IGF2BP2 were predicted by the Starbase database. List 2: Differentially expressed genes in IGF2BP2-depleted UMUC3 cells compared to the control group. List 3: Differentially expressed genes in IGF2BP2-depleted J82 cells versus the control group. (e) The top 30 KEGG pathways enriched by the 206 potential IGF2BP2 targets. (f) The top 30 biological processes enriched by the 206 possible IGF2BP2 targets.
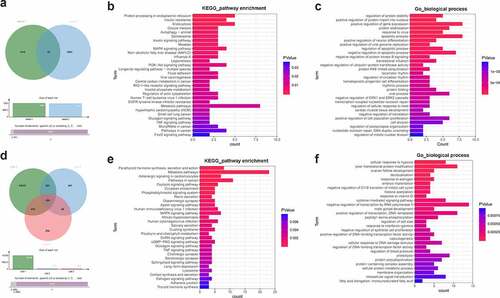
Figure 5. YTHDF3 or IGF2BP2 knockdown inhibited the hypoxia/reoxygenation-induced activation of AKT, NF-κB, ERK1/2, and P38 pathways in BEAS-2B cells. BEAS-2B cells were transfected with or without si-NC, si-YTHDF3, or si-IGF2BP2 for 48 h. Transfected or non-transfected cells received the treatment of normoxia or hypoxia/reoxygenation. Hypoxia/reoxygenation conditions: 6 h of exposure to hypoxic conditions (5% CO2, 94%N2, 1% O2) and another 6 h of normoxic (95% air, 5% CO2) treatment. Protein levels of AKT, p-AKT, p65, p-p65, ERK1/2, p-ERK1/2, p38, and p-p38 were measured by western blot assay.