Figures & data
Figure 1. MiR-410-3p is upregulated in Ang II–induced hypertrophic cardiomyocytes. (a-d). QRT-PCR analysis of expression pattern of hypertrophic markers (ANP, BNP, β-MHC) and miR-410-3p in cardiomyocytes in response to increasing doses of Ang II. **P < 0.01 compared with Ctr group
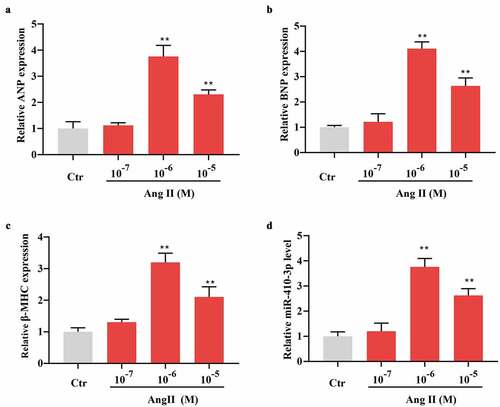
Figure 2. MiR-410-3p inhibitor suppresses Ang II–induced cardiomyocyte hypertrophy. (a). QRT-PCR analysis of miR-410-3p levels in cardiomyocytes following transfection of miR-410-3p inhibitor. (b). Phalloidin staining analysis of cell size of cardiomyocytes following Ang II treatment in the absence or presence of miR-410-3p inhibitor. (c-e). QRT-PCR analysis of expression level of hypertrophic markers (ANP, BNP, β-MHC) in cardiomyocytes in response to Ang II in the absence or presence of miR-410-3p inhibitor. **P < 0.01 compared with Ctr group; ##P < 0.01 compared with Ang II group
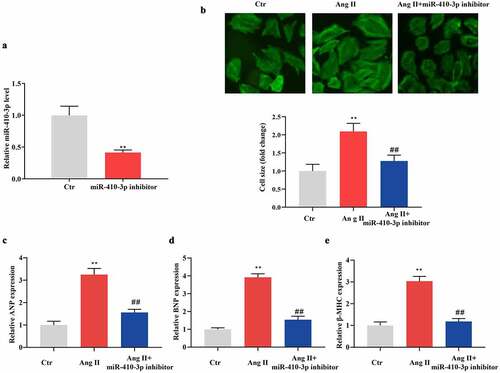
Figure 3. MiR-410-3p mimics inhibits the level of Smad7. (a). Venn diagram showing the potential target genes of miR-410-3p from prediction algorithms TargetScan and miRDB. (b). Predicted target sequences for miR-410-3p in the 3′UTR of Smad7. (c). Dual-luciferase assay to determine binding relationship between miR-410-3p and Smad7. (d). Western blot analysis of Smad7 expression in cardiomyocytes in response to Ang II in the absence or presence of miR-410-3p inhibitor. **P < 0.01 compared with Ctr group; ##P < 0.01 compared with Ang II group
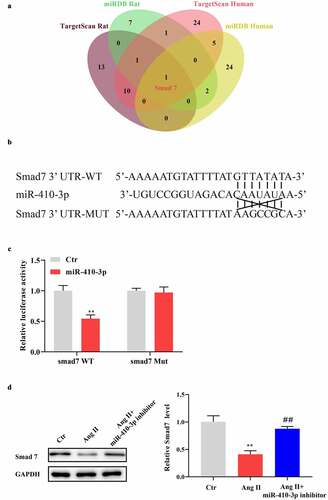
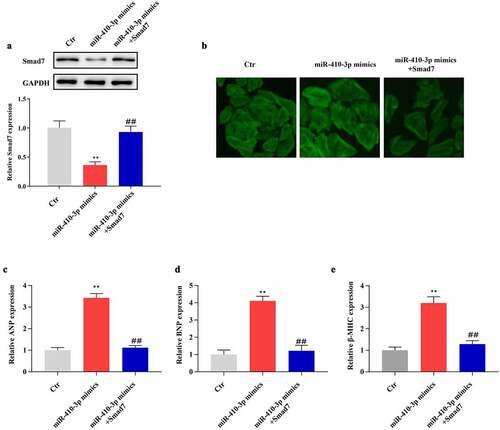
Figure 4. Smad7 overexpression antagonizes the effect of miR-410-3p mimics on cardiac hypertrophy. (a). Western blot analysis of Smad7 expression in cardiomyocytes in response to miR-410-3p mimics transfection in the absence or presence of Smad7 overexpression vector. (b). Phalloidin staining analysis of cell size of cardiomyocytes following miR-410-3p mimics transfection in the absence or presence of Smad7 overexpression vector. (c-e). QRT-PCR analysis of expression level of hypertrophic markers (ANP, BNP, β-MHC) in cardiomyocytes in response to miR-410-3p mimics transfection in the absence or presence of Smad7 overexpression vector. **P < 0.01 compared with Ctr group; ##P < 0.01 compared with miR-410-3p mimics group