Figures & data
Figure 1. Behavioral characterization of rats following CCI. Mechanical allodynia (a) and thermal hyperalgesia (b) were induced after CCI surgery (n = 8). (c). Sucrose preference test (n = 8). (d). CCI rats spent more time in the light area than sham rats during the PEAP test (n = 6). Results are represented as means ± SD. Two-way ANOVA; *p< 0.05 vs. sham group, ***p< 0.001 vs. sham group.
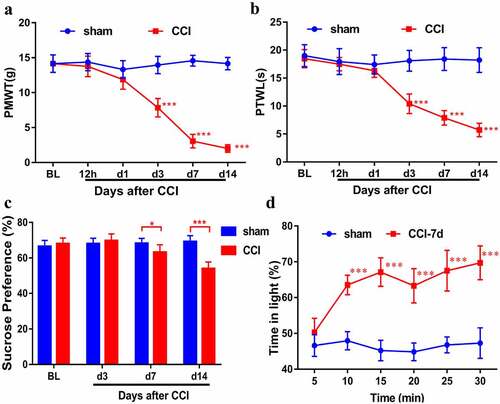
Figure 2. Quality control of the raw RNA sequencing dataset of the ACC. (a). Heatmap of the correlations between each sample using the Pearson test. (b). The summary of quality control of the raw RNA sequencing dataset showing raw reads, clean reads, clean ratio, mapping ratio and Q20 (Phred quality Q scores) of the 18 samples.
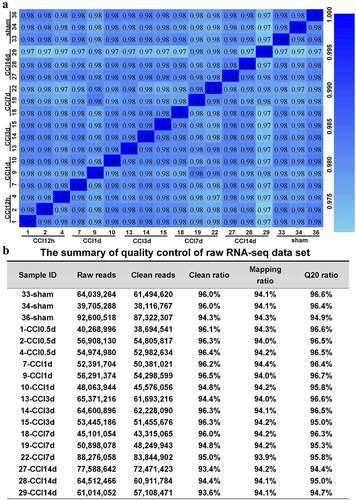
Figure 3. Regulation of transcripts in the ACC of rats following CCI. (a-e). Volcano plots of all the DEGs of the sham group compared with those of the CCI groups. Log2(fold change) is plotted as the abscissa, and -log10(p-value) is plotted as the ordinate. Up-regulated genes are red and down-regulated genes are green. Gray dots represent genes with no significant difference. (f). Venn diagram showing the number of unique and shared DEGs with a fold change > 1.5 and p-value < 0.05 at each time point. (g). Histogram showing the statistics of up- and down-regulated DEGs at each time point.
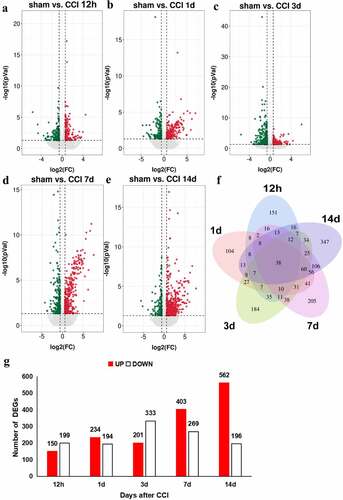
Figure 4. Gene ontology analysis of DEGs. GO analysis showing the top 30 significantly enrichments of DEGs for biological processes (a), cellular components (b) and molecular functions (c). GO terms are plotted as the ordinate, and the gene number is plotted as the abscissa.
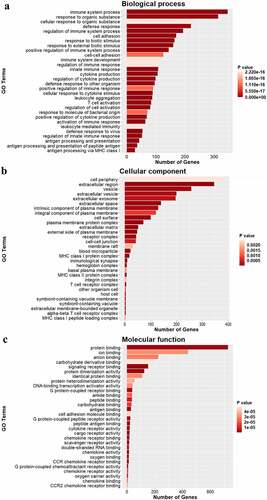
Figure 5. KEGG pathway analysis of DEGs. The comparison of pathway enrichment in the ACC of rats following CCI. The top 30 significantly enriched KEGG pathways are shown. The KEGG terms are plotted as the ordinate and the rich factor is plotted as the abscissa. The size of the dots represented the gene number.
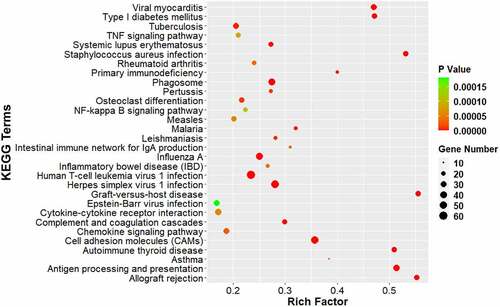
Figure 6. Short time-series expression miner analysis of DEGs in the ACC following CCI. (a). Model profiles of time series gene expression. Data were sampled at six time points: 0 days (sham), 12 hours, and 1, 3, 7 and 14 days after CCI. The profile ID number is in the top left-hand corner, and the profiles with statistical differences are shown in color. (b). Significant model profiles provided detailed information on the K-means cluster.
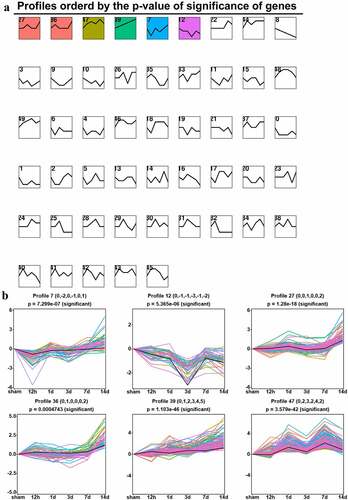
Table 1. Function analysis of DEGs for profiles 27, 36, and 39. Gene symbols of DEGs are shown
Figure 7. PPI network nalysis of DEGs. STRING analysis for the PPI networks of DEGs for profiles 27 and 36. Network nodes represent proteins. Edges represent protein-protein associations, which include known interactions, predicted interactions, text mining, co-expression and protein homology. PPI enrichment p-value< 0.001.
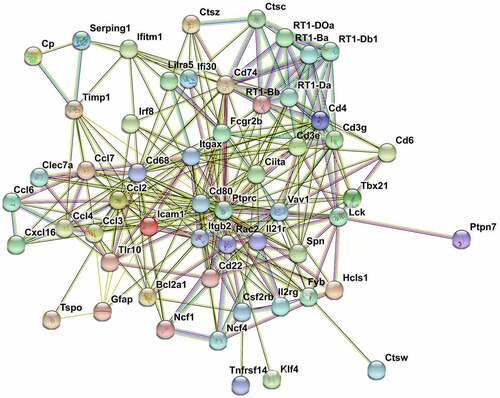
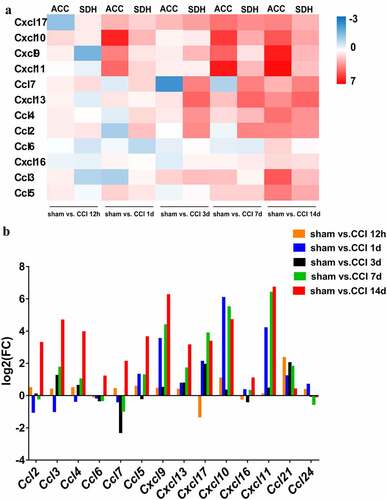
Figure 8. Similar expressional changes of chemokines in the ACC and spinal cord. (a). Heatmap showing the expression patterns of genes. Down- and up-regulated genes are presented according to the color bars (blue to red). (b). Bar chart showing the dynamic expression series of genes in the ACC.