Figures & data
Figure 1. Schematic flowchart of Patient selection and metabolic profiling strategy used in this study. UPLC/MS, ultra-performance liquid chromatography and mass spectrometry; ECMO extracorporeal membrane oxygenation, VF ventricular fibrillation; PCI, percutaneous coronary intervention.
Table 1. Baseline characteristics of the patients in the unmatched and propensity-matched groups
Table 2. Laboratory examination of the patients in the unmatched and propensity-matched groups
Figure 2. The total ion chromatogram of the metabolic profiles in different groups was obtained from SIMCA-P 12.0 (one sample chosen randomly). VF: group with ventricular fibrillation; non-VF: group without VF.
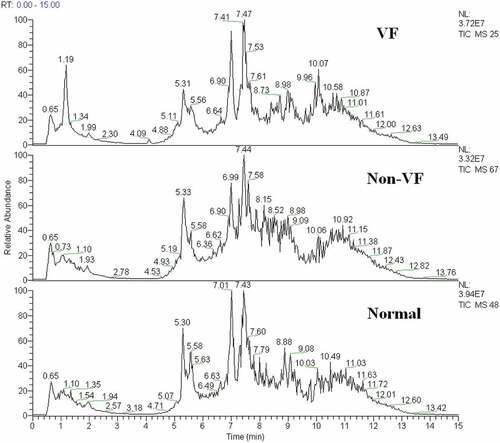
Figure 3. (a) The score plot for the first two principal components was shown. (b) OPLS-DA score plot with two predictive principal components and six orthogonal principal components was built (R2X = 71.1%, R2Y = 79.9%, Q2 = 46%) for all participants (VF, non-VF and healthy control (normal). (c) OPLS-DA score plot of the VF (VF) and non-VF (non-VF) group. One predictive principal component and four orthogonal principal components (R2X = 51%, R2Y = 92.4%, Q2 = 60.3%). Notes: All figures were developed from SIMCA-P 12.0 and every point represents a sample. R2 scores suggest performance of a model, and Q2 scores is an assessment of reproducibility, based on cross-validation.
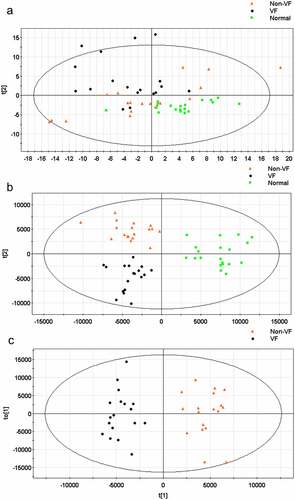
Table 3. Differential metabolites between VF and non-VF groups
Figure 4. Heat map of differential metabolites in VF and non-VF groups demonstrate hierarchical clustering of altered metabolites in clustering analysis in different groups.
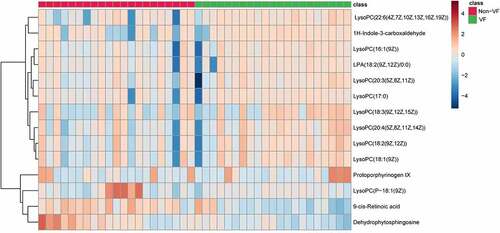
Figure 5. Pathway analysis summaries from MetaboAnalyst 5.0. All involved pathways are displayed as circles.
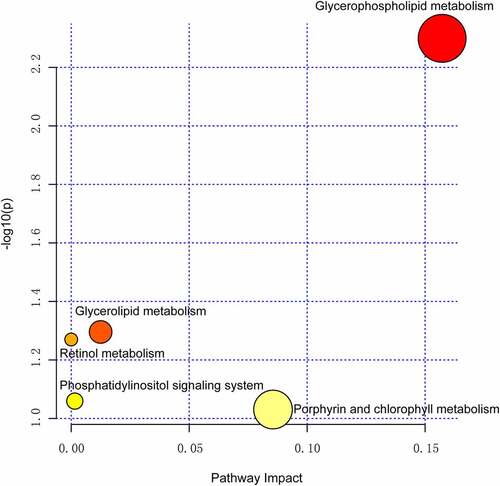
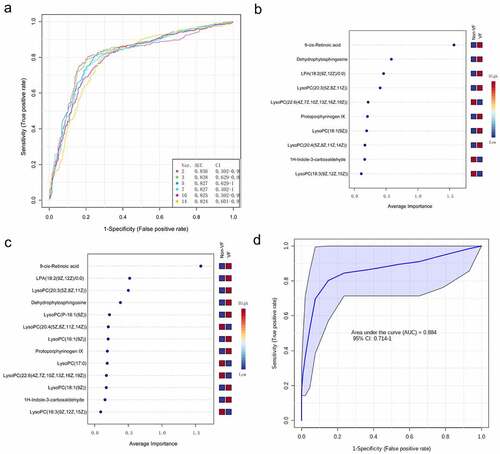
Figure 6. Univariate receiver operating characteristic curve for biomarker identification showed that 9-cis-retinoic acid and dehydrophytosphingosine were the two most important biomarkers, the area under the curve was 0.864 and 0.837 respectively.
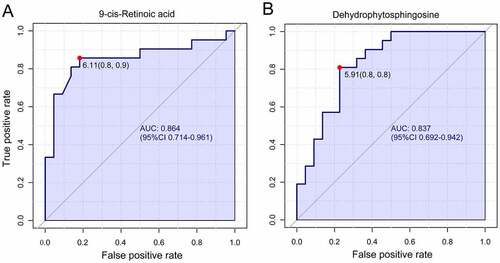
Figure 7. The process of feature screening, model construction, and performance assessment performed by Monte-Carlo cross-validation via MetaboAnalyst 5.0 (a) ROC curves of all models on the base of cross-validation performance. (B and C) In the model construction and performance assessment of biomarker prediction based on Monte Carlo cross-validation, significant biomarkers were ranked according to their frequencies of selection in Model 1 (b) and Model 2 (c). 9cRA was found to have the highest probability of appearing in these two models during cross-validation. (d) A ROC curve based model evaluation was conducted, in which the combination of 9cRA and dehydrophytosphingosine were selected.