
Figures & data
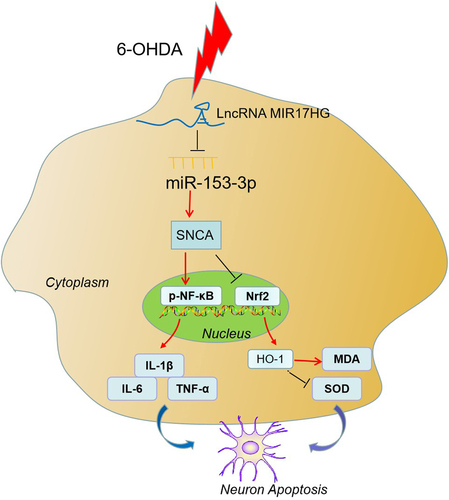
Figure 1. Expression features of LncRNA MIR17HG and miR-153-3p in PD patients.
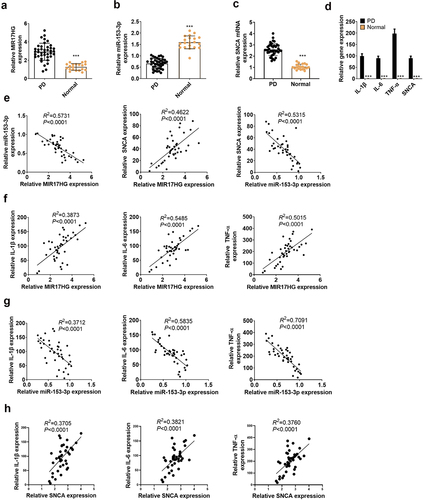
Figure 2. Expression features of LncRNA MIR17HG, SNCA and miR-153-3p in the PD model.
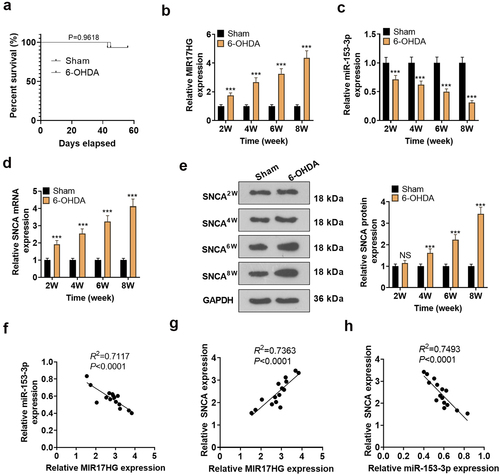
Figure 3. Attenuating MIR17HG mitigated neuronal apoptosis in the PD model in vitro and in vivo.
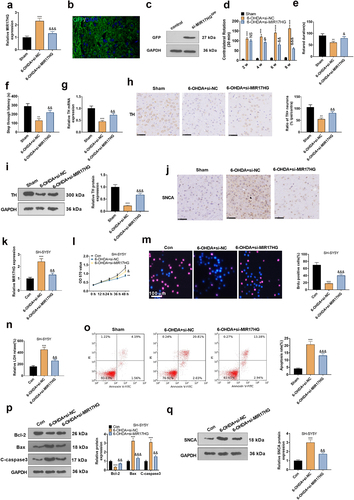
Figure 4. Inhibition of MIR17HG curbed the inflammatory response in microglia in PD models both in vivo and in vitro.
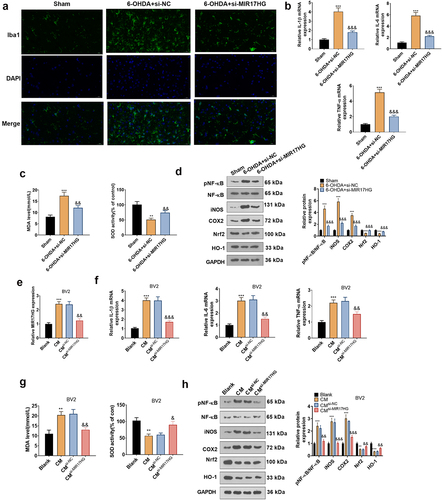
Figure 5. MIR17HG targeted miR-153-3p.
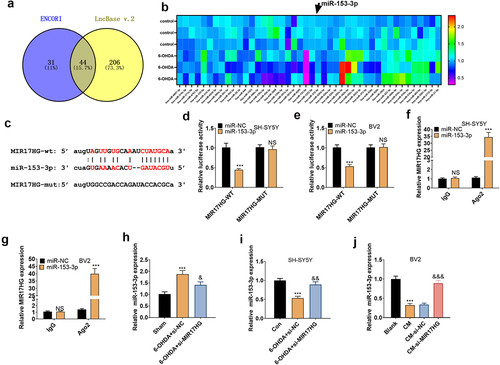
Figure 6. Overexpressing miR-153-3p tarnished neuronal apoptosis and microglial inflammation.
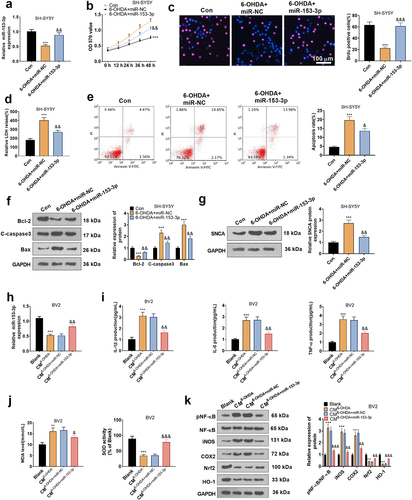
Figure 7. miR-153-3p targeted SNCA.
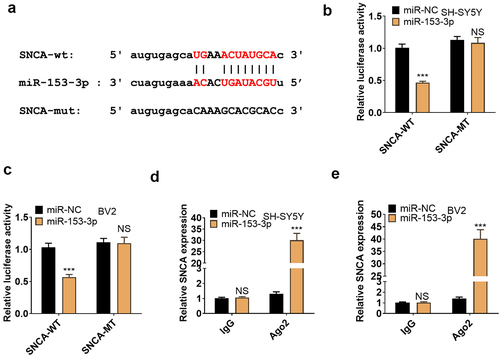
Figure 8. Overexpressing SNCA impaired the anti-inflammatory and anti-neuronal apoptotic effects of miR-153-3p.
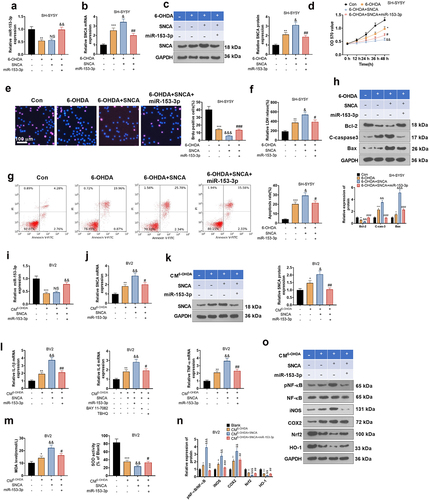
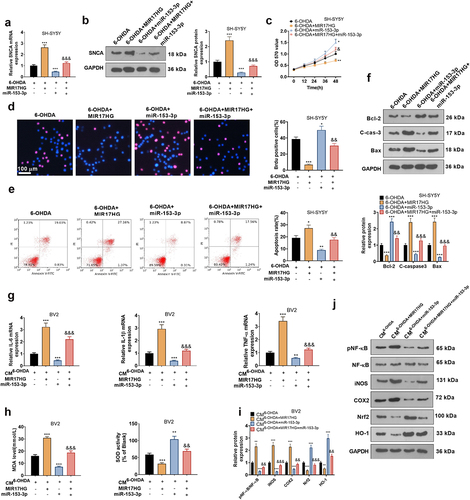
Figure 9. MIR17HG hindered the anti-inflammatory and anti-neuronal apoptotic properties of miR-153-3p.
Supplemental Material
Download Zip (468.5 KB)Data availability statement
The data sets used and analyzed during the current study are available from the corresponding author on reasonable request.