
Figures & data
Table 1. Primer sequences used in this study
Figure 1. HG induced MS-1 cell apoptosis and oxidative stress and reduced viability. (a) The viability of MS-1 cells was observed at 24 and 48 h after treatment via CCK-8 assay. (b) Nitric oxide levels in the supernatants of MS-1 cells treated with HG were quantified. (** p < 0.01, *** p < 0.001).
Figure 2. Effect of FXR on the endothelial dysfunction induced by HG conditions. (a) FXR, VEGF-A and eNOS expression was measured via WB analysis. (b) FXR, VEGF-A and eNOS mRNA expression was detected by real-time PCR. (c) The viability of MS-1 cells was observed after treatment via CCK-8 assay. (d) The proliferation of MS-1 cells was measured after treatment via EdU staining (Scale bar = 50 μm); (e) Nitric oxide levels were measured in the supernatants of MS-1 cells in which FXR or VEGF-A activity was inhibited (* p < 0.05, *** p < 0.001).
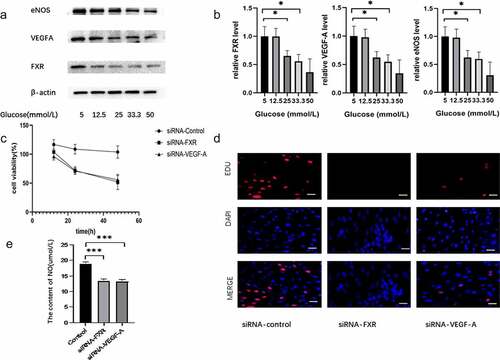
Figure 3. Metformin ameliorated HG-induced MS-1 cell injury. (a) The viability of metformin-treated MS-1 cells was observed after different time points via CCK-8 assay. (b) The proliferation of MS-1 cells was observed after metformin treatment via EdU staining (Scale bar = 50 μm). (c) NO levels were quantified in the supernatants of MS-1 cells treated with different concentrations of metformin. (d) FXR, VEGF-A and eNOS levels were detected via WB analysis. (e) FXR, VEGF-A and eNOS mRNA expression was detected by real-time PCR. (* p < 0.05, ** p < 0.01, *** p < 0.001).
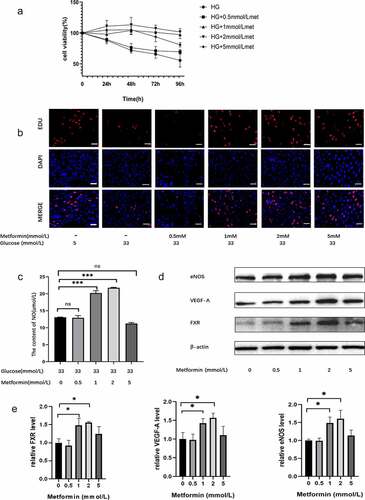
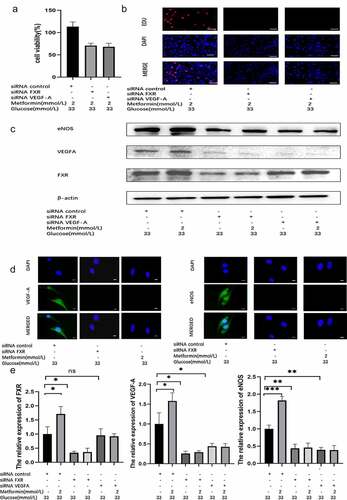
Figure 4. Metformin treatment alleviated HG-induced injury by regulating the FXR/VEGF-A/eNOS signaling pathway. (a) The viability of metformin-treated MS-1 cells in which FXR or VEGF-A activity was inhibited was observed after 48 h via CCK-8 assay. (b) The proliferation of metformin-treated MS-1 cells in which FXR or VEGF-A activity was inhibited was observed after 48 h via EdU staining (Scale bar = 50 μm). (c) FXR, VEGF-A and eNOS levels were detected via WB analysis. (d) FXR, VEGF-A and eNOS levels were detected via immunofluorescence (Scale bar = 20 μm). (e) FXR, VEGF-A and eNOS mRNA expression was detected by real-time PCR. (* p < 0.05, ** p < 0.01, *** p < 0.001).
Supplemental Material
Download MS Power Point (1.2 MB)Data availability statement
The raw data supporting the conclusions of this article will be made available by the authors, without undue reservation (http://dx.doi.org/10.1080/21655979.2022.2033411).