Figures & data
Table 1. List of q-PCR primers used in this study
Figure 1. Cell culture and identification of human umbilical cord mesenchymal stem cells (hUC-MSCs). (a) Representative image of isolated P2 hUC-MSCs. A large number of spindle cells that resemble fibroblasts were observed (scale: 100 μm; magnification: 100 ×). (b) Flow cytometry was used to detect the surface markers of hUC-MSCs like clusters of differentiation (CD) (CD90, CD105, CD34, CD45), and human leukocyte antigen-DR markers (HLA-DR) .
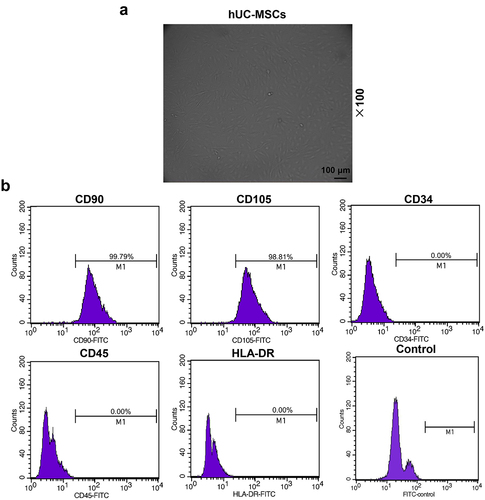
Figure 2. Transplantation of hUC-MSCs continued to survive in the spinal cord after 8 weeks. (a) The Basso, Beattie and Bresnahan (BBB) score was used to assess the motor function of Control, Sham, SCI or hUC-MSCs group rats from the first week to the eighth week of modeling. HUC-MSCs helped SCI rats recover their exercise capacity. (b) The immunofluorescence staining exhibited that transplanted hUC-MSCs continued to survive in the spinal cord after 8 weeks (scale: 50 μm; magnification: 200×).
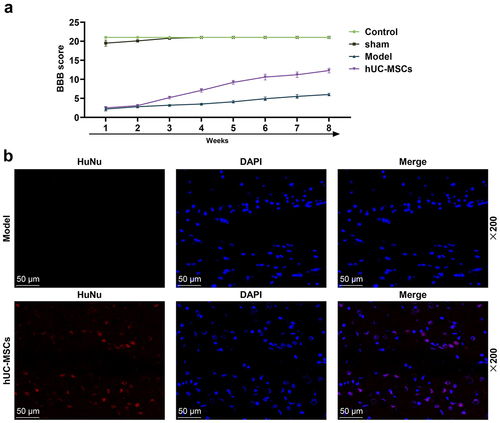
Figure 3. Transplantation of hUC-MSCs partially restored the motor function of spinal cord injury (SCI) rats by ameliorating the destructive lesions. (a–e) Transplantation of hUC-MSCs ameliorated spinal cord and bladder lesions induced by SCI. Hematoxylin–eosin (HE) staining of the dorsal side of the spinal cord (scale: 200 μm; magnification: 100×) (a). Luxol fast blue (LFB) was applied to assess the survival rate of neuronal cells in the spinal cord injury area (scale: 200 μm, magnification: 100 ×) (b-c). HE staining of bladder tissues (scale: 200 μm; magnification: 100×) (d). Masson’s trichrome staining of bladder tissues (scale: 200 μm; magnification: 100×) (e). *** P < 0.001 vs. Sham, # P < 0.05 vs. Model.
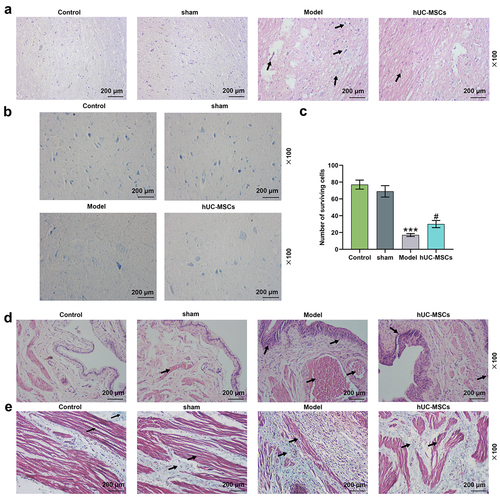
Figure 4. Transplantation of hUC-MSCs ameliorated bladder dysfunction induced by SCI. (a–d) Analyses of bladder functions, including bladder capacity (mL) (a), urine volume (mL) (b), residual urine volume (mL) (c) and urination efficiency (%) (d). (e) After the bladder examination, the bladder was taken for weight assessment (mg). ***P < 0.001 vs. Sham, #P < 0.05, ##P < 0.01, ###P < 0.001 vs. Model.
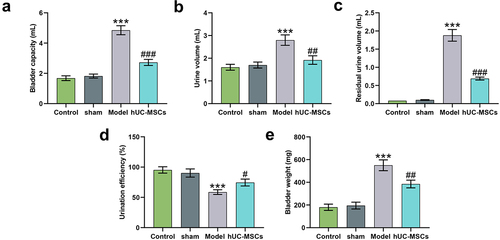
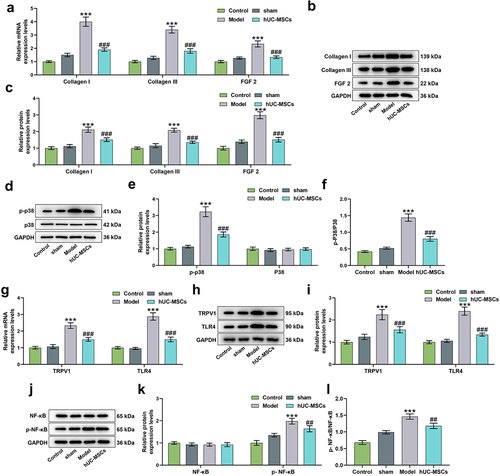
Figure 5. Real-time quantitative PCR (q-PCR) and Western blot were used to detect bladder tissue-related mRNA and protein expressions, respectively. (a–l) HUC-MSC treatment reversed the upregulations of Collagen I, Collagen III, fibroblast growth factor-2 (FGF 2) (a–c), p-p38 (d-f), transient receptor potential vallinoid 1 (TRPV1), toll-like receptor 4 (TLR4) (g-i) and p-NF-κB (j–l) induced by SCI. GAPDH was used as an internal reference. ***P < 0.001 vs. Sham, ##P < 0.01, ###P < 0.001 vs. Model.