Figures & data
Table 1. General characteristics (pH; glucose, g/L; fructose, g/L; sucrose, g/L) of olive oil mill wastewater (OOMW)
Figure 1. Dried weight of BCs produced in a) HS medium and its enriched with different OOMW fractions (25–100%) and b) OOMW (75% and 100%) media enriched with various nutrients (yeast extract (5 g/L), yeast extract (5 g/L) and peptone (5 g/L), and HS components (without glucose)). Error bars indicate sample standard deviations. Different letters indicate significant differences (P < 0.05).
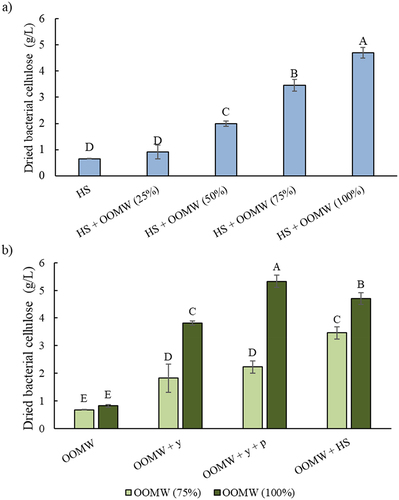
Figure 2. FT-IR analyses of OOMW and BCs produced in HS and OOMW media enriched with various nutrients (OOMWa; without supplementation, OOMWb; yeast extract (5 g/L), OOMWc; yeast extract (5 g/L) and peptone (5 g/L), and OOMWd; HS components (without glucose)).
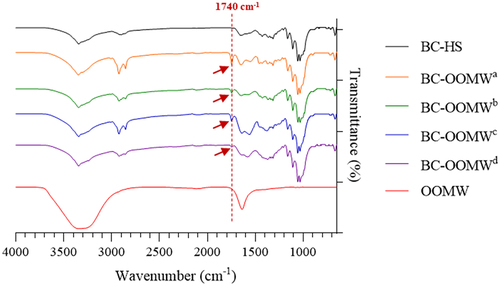
Table 2. The residual amount (%) of BCs, produced from different media (HS and OOMW), based on the TGA analysis
Figure 3. TGA curves of BC samples produced in HS and OOMW media enriched with various nutrients (OOMWa; without supplementation, OOMWb; yeast extract (5 g/L), OOMWc; yeast extract (5 g/L) and peptone (5 g/L), and OOMWd; HS components (without glucose)).
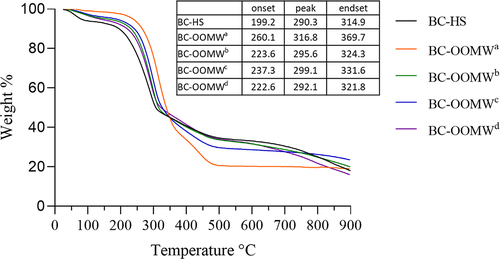
Figure 4. The XRD patterns of BCs produced in HS and OOMW media.
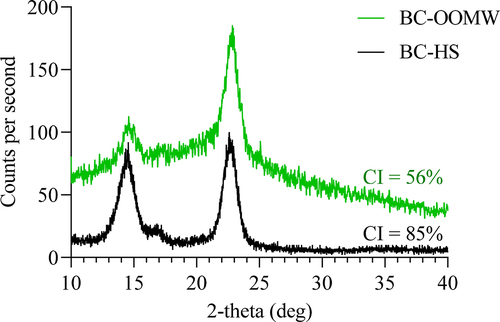
Figure 5. SEM images of BCs produced in a) HS and b) OOMW media.
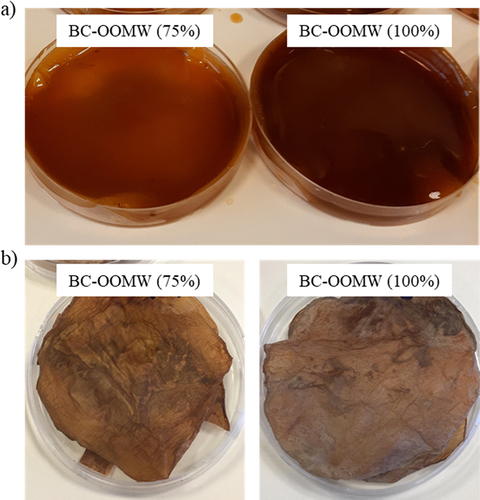
Figure 6. BC pellicles obtained from OOMW media a) wet form and b) dry form.