Figures & data
Figure 1. IFC-305 treatment prevented I/R induced kidney injury (* P value < 0.05, vs control group; # P value < 0.05, vs. I/R group). A: H&E staining showed an increased level of renal injury in I/R rats, while the IFC-305 treatment alleviated the severity of I/R-induced renal injury (magnification, x200; arrow denotes injured renal tubules). B: The level of creatinine was increased in I/R rats and reduced by IFC-305 treatment.
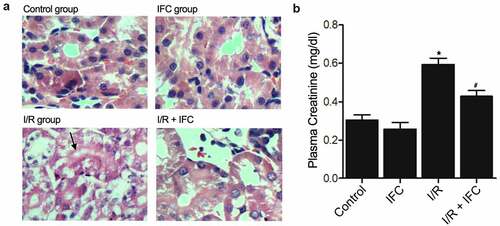
Figure 2. Up-regulation of Hcy and down-regulation of CSE in the renal tissue and blood of I/R rats (* P value < 0.05, vs Control group; # P value < 0.05, vs. I/R group). A: Hcy concentration was elevated in the renal tissue of I/R rats and suppressed by subsequent IFC-305 treatment. B: Hcy concentration was elevated in the peripheral blood of I/R rats and suppressed by subsequent IFC-305 treatment. C: ELISA analysis showed that the decreased CSE activity in the renal tissue of I/R rat was restored by IFC-305 treatment. D: qPCR analysis showed that the decreased CSE mRNA expression in the renal tissue of I/R rat was restored by IFC-305 treatment. E: Western blot analysis showed that the decreased CSE protein expression in the renal tissue of I/R rat was restored by IFC-305 treatment.
Figure 3. IFC-305 reduced the abnormally high level of DNA methylation of the CSE promoter in the renal tissue of I/R rats. The level of DNA methylation of CSE promoter was enhanced in the renal tissue of I/R rats and repressed by subsequent IFC-305 treatment.
Figure 4. IFC-305 restored the normal levels of H2S, MDA and superoxide in the renal tissue and peripheral blood of I/R rats (* P value < 0.05, vs Control group; # P value < 0.05, vs. I/R group). A: H2S concentration was decreased in the renal tissue of I/R rats and restored by subsequent IFC-305 treatment. B: H2S concentration was decreased in the peripheral blood of I/R rats and restored by subsequent IFC-305 treatment.C: MDA was increased in the renal tissue of I/R rats and reduced by subsequent IFC-305 treatment. D: Superoxide was increased in the renal tissue of I/R rats and reduced by subsequent IFC-305 treatment.
Figure 5. IFC-305 restored the normal CSE activity in HK-2 cells undergoing Hcy treatment (* P value < 0.05, vs. untreated group; # P value < 0.05, vs. Hcy group). A: ELISA analysis showed that the decreased CSE activity in HK-2 cells undergoing Hcy treatment was restored by the subsequent IFC-305 treatment. B: qPCR analysis showed that the decreased CSE mRNA expression in the HK-2 cells undergoing Hcy treatment was restored by the subsequent IFC-305 treatment. C: Western blot analysis showed that the decreased CSE protein expression in the HK-2 cells undergoing Hcy treatment was restored by the subsequent IFC-305 treatment.
Figure 6. IFC-305 reduced the abnormally high level of DNA methylation of CSE promoter in Hcy-treated HK-2 cells. The level of DNA methylation of CSE promoter was enhanced in Hcy-treated HK-2 cells and repressed by subsequent IFC-305 treatment.
Figure 7. IFC-305 restored the normal levels of H2S, MDA and superoxide in Hcy-treated HK-2 cells (* P value < 0.05, vs. untreated group; # P value < 0.05, vs. Hcy group). A: H2S concentration was decreased in the supernatant of Hcy-treated HK-2 cells and restored by IFC-305 treatment. B: H2S concentration was decreased in Hcy-treated HK-2 cells and restored by IFC-305 treatment. C: MDA was increased in Hcy-treated HK-2 cells and reduced by IFC-305 treatment. D: Superoxide was increased in Hcy-treated HK-2 cells and reduced by IFC-305 treatment.