Figures & data
Figure 1. PD models in vivo and in vitro. Pole test determination on the indexes of (a) T-turn time and (b) T-descend time. (c) Rotarod test determination of retention time. (d) Immunohistochemistry was conducted to measure changes in the proportion of TH positive cells. (e) qRT-PCR determination of NEAT1 expression in the brain, (f) dopaminergic neurons and (g) SH-SY5Y cells treated with different MPP+ concentrations. *p < 0.05, vs. the control (a–f). *p < 0.05, vs. MPP+ (0 μmol/L) (G).
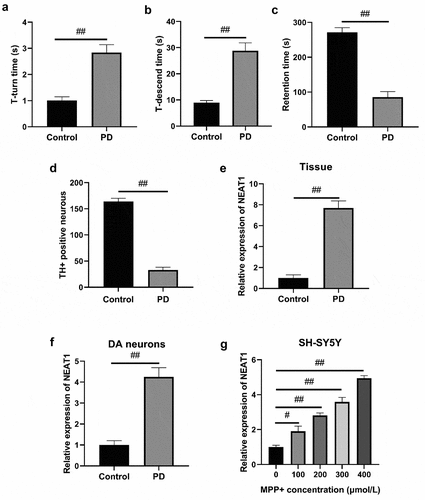
Figure 2. NEAT1 accelerated apoptosis of MPP+-induced SH-SY5Y cells. (a) qRT-PCR results of the NEAT1 level in SH-SY5Y cells. (b) MTT assay on SH-SY5Y cell viability. (c) Flow cytometry on SH-SY5Y cell apoptosis. (d) Dopamine content was analyzed with HPLC. (e) Western blot results on the expressions of Bax, Bcl-2, and caspase-3. *p < 0.05, vs. MPP+ (A). *p < 0.05, vs. control group; #p < 0.05, vs. MPP+ (b–e).
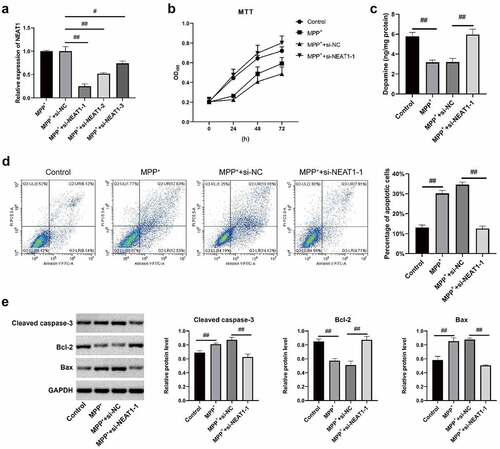
Figure 3. NEAT1 accelerated SH-SY5Y cell autophagy after MPP+ induction. (a) qRT-PCR and (b) Western blot assays were conducted to detect LC I, LC3 II, and P62 on mRNAl and protein levels. (c) The changes of autophagosome were measured through immunofluorescence. *p < 0.05, vs. control; #p < 0.05, vs. MPP+.
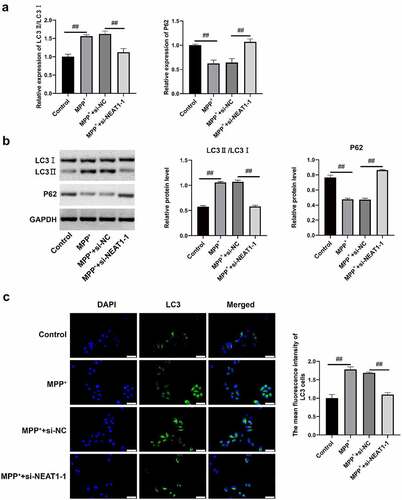
Figure 4. miR-107-5p is the target gene of NEAT1. (a) The binding site of NEAT1 and miR-107-5p predicted via StarBase3. (b) Dual luciferase reporter gene assay detection of the luciferase activity of the vector. (c) RNA pull-down assay verification of interplay within NEAT1 and miR-107-5p. The expressions of miR-107- 5p in (d) brain, (e) dopaminergic neurons, and (f) SH-SY5Y cells via qRT-PCR. (g) qRT-PCR determination of miR-107-5p expression in SH-SY5Y cells after nucleotide transfection. (h) NEAT1 expression in SH-SY5Y cells shows a negative correlation with miR-107-5p. *p < 0.05, vs. miR-NC (B). *p < 0.05, vs. Bio-NC (C). *p < 0.05, vs. control (d and e). *p < 0.05, vs. control; #p < 0.05, vs. MPP+ (F). *p < 0.05, vs. Mock (g and h).
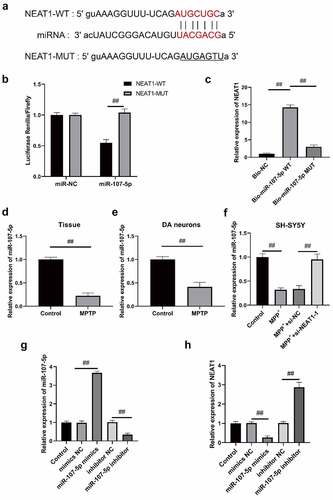
Figure 5. NEAT1 facilitated SH-SY5Y cell apoptosis and autophagy after MPP+ induction via targeting miR-107-5p. (a) MTT assay determination of SH-SY5Y cell viability. (b) Flow cytometry determination of SH-SY5Y cell apoptosis. (c) Western blot determination of LC I, LC3 II, and P62 levels. (d) Dopamine content through HPLC. *p < 0.05, vs. si-NC + inhibitor-NC; #p < 0.05, vs. si-NEAT1 + inhibitor-NC; &p < 0.05, vs. si- NC+ miR-543 inhibitor.
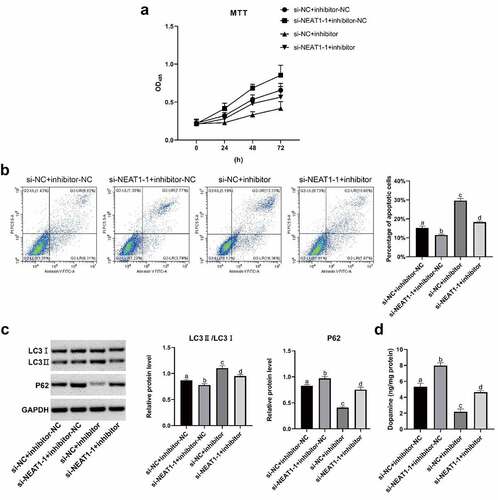
Figure 6. MPP+ induced SH-SY5Y cell autophagy was studied through CQ (a) MTT assay results on SH-SY5Y cells viability. (b) Flow cytometry results on SH-SY5Y cell apoptosis. (c) Western blot results on LC I, LC3 II and P62 proteins. *p < 0.05, vs. the MPP+; #p < 0.05, vs. the MPP+ + 3-MA; &P < 0.05, vs. the MPP+ + si-NEAT1-1; $p < 0.05, vs. MPP++CQ.
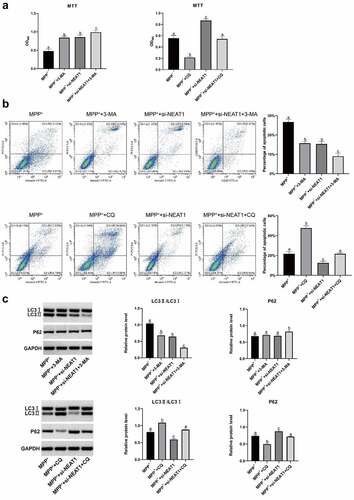
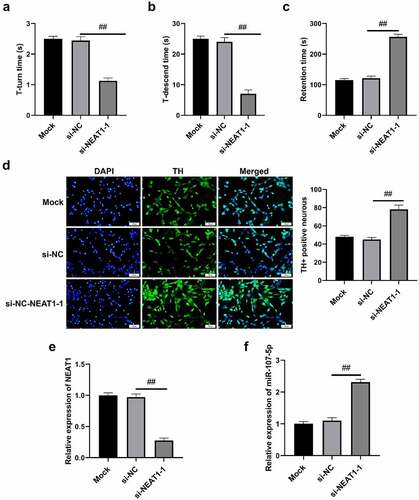
Figure 7. NEAT1 accelerated cell autophagy in PD mice. (a) T-turn time and (b) T-descend time were obtained via pole tests. (c) Retention time through rotarod tests. (d) Immunohistochemistry results in changes in TH+ positive cells. (e) qRT-PCR results of NEAT1 and miR-107-5p levels. *p < 0.05, vs. Mock and si-NC.