Figures & data
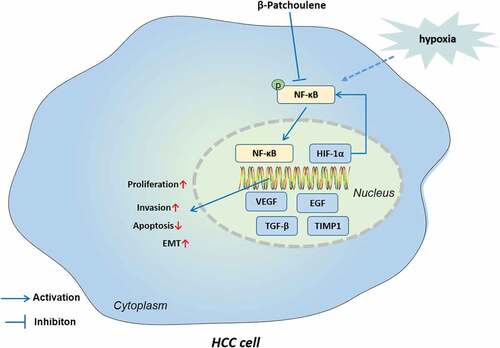
Table 1. Specific primer sequences
Figure 1. β-PAE suppressed the proliferation of HCC cells Huh-7 and MHCC97 cells were processed with different concentrations (0, 0.3125, 0.625, 1.25, 2.5, 5, 10, 20 μM) of β-PAE for 48 hours. A. The viability of Huh-7 and MHCC97 cells treated with different concentrations of β-PAE (0–20 μM) was assayed with CCK-8. B. The proliferation of Huh-7 and MHCC97 cells processed with different concentrations of β-PAE (0–10 μM) was examined by the colony formation assay. NS P > 0.05, *P < 0.05, **P < 0.01, ***P < 0.001, ****P < 0.0001 (vs. veh group). n = 3.
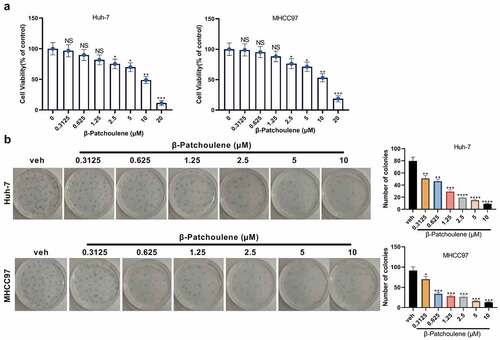
Figure 2. β-PAE suppressed hypoxia-induced HCC cell proliferation A hypoxic injury model was set up in HCC cells, and hypoxia-induced Huh-7 and MHCC97 cells were treated with 2.5 μM β-PAE for 48 hours. A.CCK-8 was adopted to check the viability of Huh-7 and MHCC97. B. Proliferation of Huh-7 and MHCC97 cells was assessed using the colony formation assay. C. The apoptotic rate of Huh-7 and MHCC97 cells was tested by flow cytometry. D.TUNEL was developed for the detection of apoptosis in Huh-7 and MHCC97 cells. E. Expression of the apoptosis-inhibitory protein Survivin in Huh-7 and MHCC97 cells was probed by WB. *P < 0.05, **P < 0.01, ***P < 0.001 (vs. N group).#P < 0.05, ##P < 0.01, ###P < 0.001 (vs. H group). n = 3.
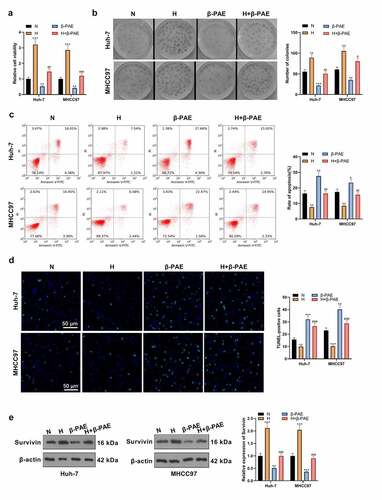
Figure 3. β-PAE suppressed hypoxia-induced migration, invasion and EMT of HCC cells Hypoxia-induced Huh-7 and MHCC97 cells were treated with 2.5 μM β-PAE for 48 hours. A. Invasive ability of Huh-7 and MHCC97 cells was tested by the Transwell assay. B. WB was employed to monitor the expression of EMT markers (MMP2, MMP9, E-cadherin, N-cadherin and Vimentin) in Huh-7 and MHCC97 cells. *P < 0.05, **P < 0.01, ***P < 0.001 (vs. N group).#P < 0.05, ##P < 0.01 (vs. H group), n = 3.
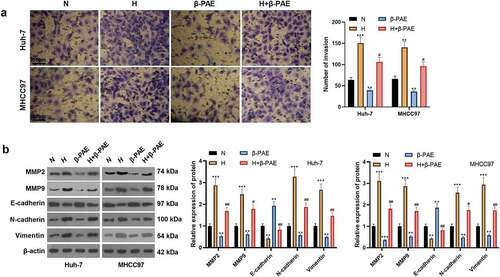
Figure 4. β-PAE hampered NF-κB and HIF-1α Hypoxia-induced Huh-7 and MHCC97 cells were manipulated with 2.5 μM β-PAE for 48 hours. A-B. The NF-κB/HIF-1α pathway expression in Huh-7 and MHCC97 cells was gauged using WB. C-D. Expression levels of NF-κB and HIF-1α were analyzed by cellular immunofluorescence. E-H. Expression of VEGFA, TGF-β, EGF and TIMP1, downstream molecules of HIF-1α, was evaluated in Huh-7 and MHCC97 cells with WB. *P < 0.05, **P < 0.01, ***P < 0.001 (vs. N group).##P < 0.01, ###P < 0.001 (vs. H group), n = 3.
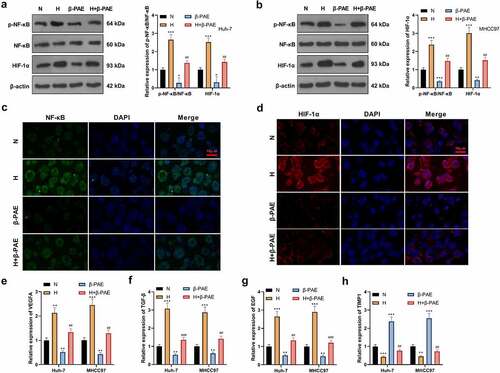
Figure 5. Activating HIF-1α wakened the β-PAE-mediated anti-tumor effectHypoxia-induced Huh-7 and MHCC97 cells were treated with 2.5 μM β-PAE for 48 h, followed by the addition of the HIF-1α agonist DMOG (200 μM). A. The viability of Huh-7 and MHCC97 cells was assayed using CCK-8. B. The colony formation assay was implemented to verify the proliferative capacity of Huh-7 and MHCC97 cells. C. Transwell assay was adopted to check the invasion of Huh-7 and MHCC97 cells. D. WB was performed to assay the expression of Survivin, MMP2, MMP9, E-cadherin, N-cadherin and Vimentin in Huh-7 and MHCC97 cells. E. The expression of the NF-κB/HIF-1α pathway in Huh-7 and MHCC97 cells was estimated by WB. *P < 0.05, **P < 0.01, ***P < 0.001 (vs. veh group). ##P < 0.01, ###P < 0.001 (vs. β-PAE group), n = 3.
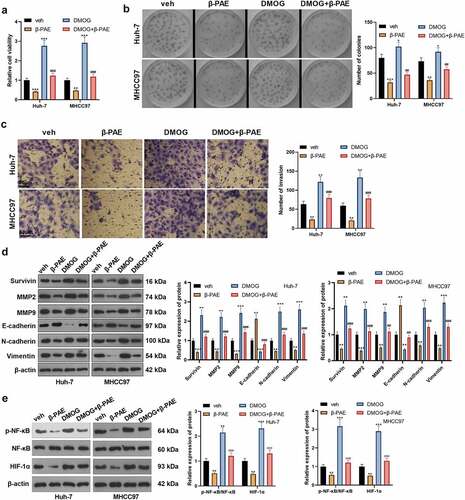
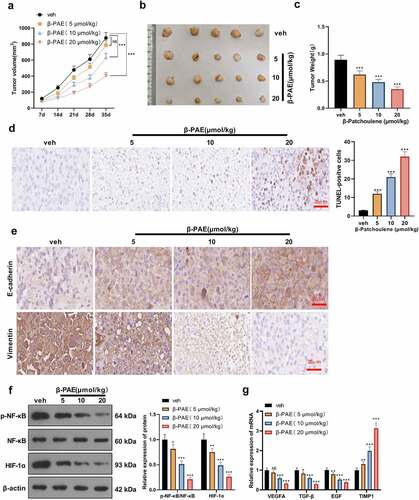
Figure 6. β-PAE hampered the growth and EMT of HCC cells in vivo MHCC97 cells were injected into the right axilla of nude mice, and an in-vivo hypoxia model was established by ligating the hepatic artery. Mice were then treated with different concentrations (5 μmoL/kg, 10 μmoL/kg, 20 μmoL/kg) of β-PAE. A. Tumor volumes of nude mice were counted weekly for 35 days. B. Tumor growth map in nude mice. C. After 35 days, nude mice were executed, and subcutaneous tumor nodules were removed and weighed. D. HCC tissue apoptosis was examined by TUNEL. E. The expression of E-cadherin and Vimentin in liver cancer tissues was assayed by immunohistochemistry. F. The expression of the NF-κB/HIF-1α pathway in HCC tissues was measured by WB. G. Expression of HIF-1α’s downstream molecules VEGFA, TGF-β, EGF and TIMP1 in HCC tissues was assessed by RT-PCR. NS>0.05, *P < 0.05, **P < 0.01, ***P < 0.001 (vs. veh group), n = 5.