
Figures & data
Table 1. RT-qPCR primer sequences for selected genes.
Figure 1. MiR-4739 expression was decreased in cancer tissues and esophageal squamous cell carcinoma (ESCC) cells compared with control cells. (a) Relative expression levels of miR-4739 in ESCC (t) samples and adjacent normal tissues (n) determined by reverse transcription-quantitative polymerase chain reaction (RT-qPCR). (b) RT-qPCR analysis of miR-4739 expression in a normal esophageal epithelial cell line (HEEC) and five human ESCC cell lines. (c) RT-qPCR analysis of miR-4739 expression in TE-1 or KYSE30 cells transfected with mimics or scramble (NC). (d) Proliferation of TE-1 and KYSE30 cells evaluated by Cell Counting Kit-8 assay. (e, f) Transwell assay showing that miR-4739 mimics inhibited the migration and invasion of ESCC cells. (g, h) Flow cytometric assay showing that the upregulation of miR-4739 expression affects ESCC cell apoptosis and cell cycle. *P < 0.05; **P < 0.01; ***P < 0.001; ****P < 0.0001.
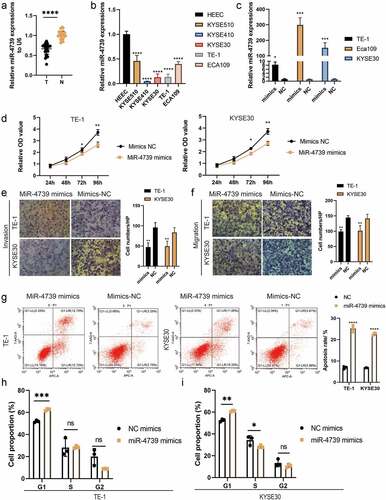
Figure 2. Upregulating miR-4739 expression reduces the proangiogenic activity of esophageal squamous cell carcinoma (ESCC) cells in vitro. (a) Representative images (left) and quantification (right) of human umbilical endothelial cells that formed tube-like structures on Matrigel-coated plates after treatment with conditioned medium (CM) derived from miR-4739 mimics or negative control ESCC cells. (b) Reverse transcription-quantitative polymerase chain reaction analysis of VEGFA messenger RNA expression levels in ESCC cultures transfected with miR-4739 mimics or scramble, normalized to those of GAPDH. (c) Enzyme-linked immunosorbent assay of vascular endothelial growth factor A (VEGFA) protein levels in the supernatants of ESCC cell cultures in which miR-4739 expression was upregulated or downregulated. (d) Western blotting of VEGFA levels in miR-4739 mimic or scrambled ESCC cells; alpha-tubulin was used as a loading control. *P < 0.05; **P < 0.01; ***P < 0.001.
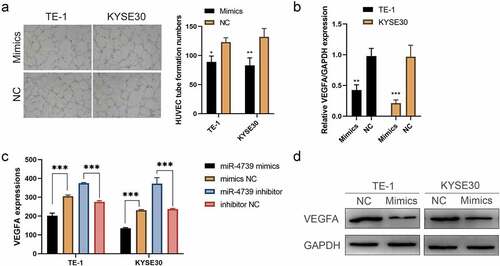
Figure 3. MiR-4739 directly targets HOXC10 expression. (a, b) Bioinformatics analysis revealed possible targets of miR-4739. (c) Messenger RNA expression levels of possible targets of miR-4739 in esophageal squamous cell carcinoma (ESCC) cells transfected with mimics or control were analyzed using reverse transcription-quantitative polymerase chain reaction. Expression levels were normalized to those of GAPDH. (d) Nucleotide sequence alignment between miR-4739 and the 3′-untranslated region (UTR) of HOXC10. (e) Dual-luciferase assays evaluating the effects of miR-4739 and scramble (NC) on the activity of the luciferase reporter containing either wild-type (WT) or mutant (MT) HOXC10 3′-UTR. (f, g) Western blotting of homeobox C10 protein levels in ESCC cells over- or under-expressing miR-4739. Protein bands were quantified using ImageJ 1.52a software. (h) The 3′-UTR-biotinylated miR-4739 binding HOXC10 messenger RNA levels were determined by an RNA pulldown assay. *P < 0.05; **P < 0.01; ***P < 0.001.
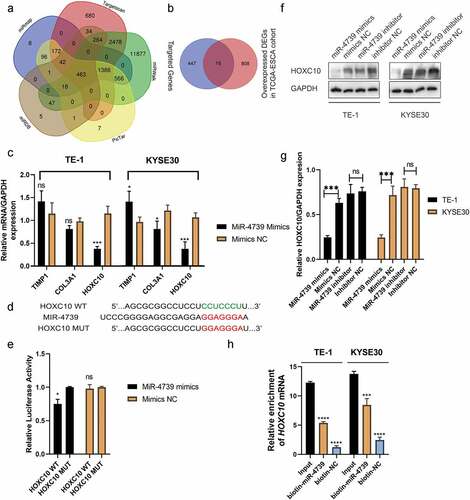
Figure 4. MiR-4739 negatively regulates vascular endothelial growth factor A (VEGFA) levels and the phosphatidylinositol 3-kinase (PI3K)/AKT signaling pathway by targeting HOXC10. (a) Representative western blot images of the effects of short interfering RNA targeting HOXC10 on esophageal squamous cell carcinoma (ESCC) cells. (b–d) Western blot and reverse transcription quantitative-polymerase chain reaction analysis of the protein and messenger RNA levels of HOXC10 and VEGFA in ESCC cells after transfection with si-HOXC10-3 and HOXC10 plasmids. (e, f) Western blotting of PI3K, p-PI3K, AKT, and p-AKT expression in TE-1 or KYSE30 cells after transfection with miR-4739 mimics or HOXC10 siRNA-3; beta-tubulin or GAPDH was used as an internal control. *P < 0.05; **P < 0.01.
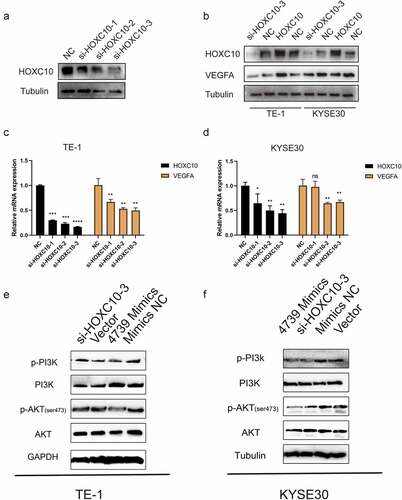
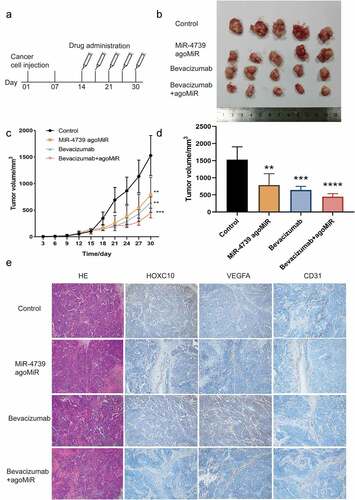
Figure 5. MiR-4739 overexpression inhibited the tumor growth and pro-angiogenic activity of TE-1 cells in vivo. (a) Schematic of agomir-4739 or scramble in a nude mouse model. (b) Tumor volumes of mice in the control, agomir-4739, bevacizumab, and agomir-4739 plus bevacizumab groups. (c) Tumor growth curve after TE-1 cell injection. (d) Tumor weights of mice. (e) Detection of homeobox C10, vascular endothelial growth factor A, and CD31 proteins in tumor tissues using immunohistochemistry (magnification, ×200). *P < 0.05; **P < 0.01.
Supplemental Material
Download Zip (24.4 MB)Data availability statement
The authors confirm that the data supporting the findings of this study are available within the article and its supplementary materials.