
Figures & data
Figure 1. Effect of H. pylori infection and VacA treatment on mouse lung tissue, examined using hematoxylin-eosin (H&E), Masson’s trichrome, and periodic acid Schiff stains. (40 ×).
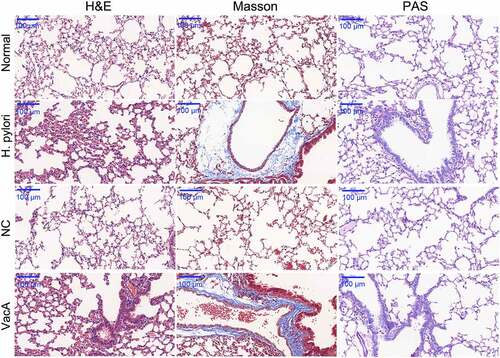
Figure 2. Effect of H. pylori infection and VacA treatment on the expression of inflammatory factors and NF-κB signaling in mice. (a) Levels of TNF-α, IL-1β, IL-6, and IL-8 in mouse blood samples after H. pylori infection and VacA treatment were measured by ELISA. (b) VacA, p-p65 NF-κB, and p65 NF-κB protein expression in mouse lung tissue after H. pylori infection and VacA treatment was analyzed by Western blotting. (c) p-p65 NF-κB protein expression in mouse lung tissue after H. pylori infection and VacA treatment was measured by immunofluorescence assay. Red arrows indicate the translocation of p65 NF-κB to the nucleus. (*P < 0.05).
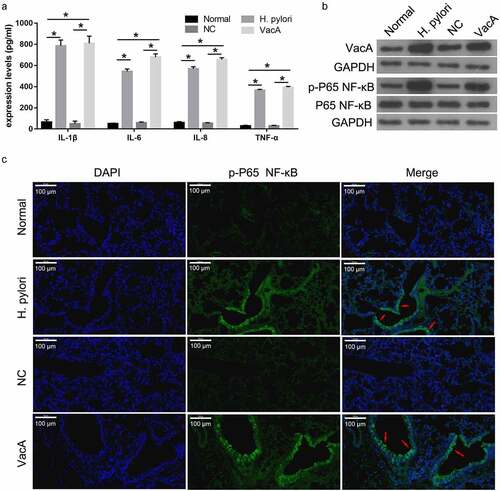
Figure 3. Effect of VacA treatment on WI-38 and BEAS-2B cell viability and apoptosis. (a and c) Cell viability after VacA treatment was assessed by MTS assay. (b and d) Cell apoptosis after VacA treatment was assessed by flow cytometry. (vs normal, *P < 0.05, vs NC, #P < 0.05).
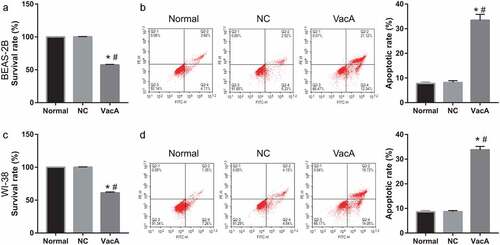
Figure 4. Effect of VacA treatment on the expression of inflammatory factors and NF-κB signaling in WI-38 and BEAS-2B cells. (a) Levels of TNF-α, IL-1β, IL-6, and IL-8 in cell supernatants after VacA treatment were measured by ELISA. (b) TNF-α, IL-1β, IL-6, and IL-8 mRNA expression in WI-38 and BEAS-2B cells after VacA treatment were measured by RT-qPCR. (c) p-p65, NF-κB, and p65 NF-κB protein expression in WI-38 and BEAS-2B cells after VacA treatment was measured by Western blotting. (d) NF- κB fluorescence intensity after VacA treatment was determined by luciferase activity assay. (e) The expression of p65 NF- κB fluorescence in nucleus and cytoplasm was analyzed by immunofluorescence. Red arrows indicate the translocation of p65 NF-κB to the nucleus. (f) The expression of p65 NF- κB fluorescence in nucleus and cytoplasm was analyzed by Western blotting. (vs normal, *P < 0.05, vs NC, #P < 0.05).
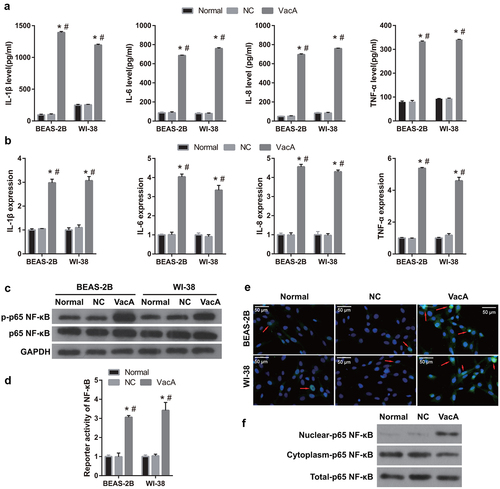
Figure 5. Alleviation of VacA-induced inflammation in WI-38 and BEAS-2B cells by the NF-κB inhibitor BAY11-7082. (a) Protein expression of p-p65, NF-κB, and p65 NF-κB after co-treatment with VacA and NF-κB inhibitor was measured by Western blotting. (b) The expression of p65 NF- κB fluorescence in nucleus and cytoplasm was analyzed by immunofluorescence after after co-treatment with VacA and NF-κB inhibitor. Red arrows indicate the translocation of p65 NF-κB to the nucleus. (c) The expression of p65 NF- κB fluorescence in nucleus and cytoplasm after after co-treatment with VacA and NF-κB inhibitor was analyzed by Western blotting. (d) Levels of TNF-α, IL-1β, IL-6, and IL-8 in cell supernatants after co-treatment with VacA and NF-κB inhibitor were measured by ELISA. (e) TNF-α, IL-1β, IL-6, and IL-8 mRNA expression in cell after after co-treatment with VacA and NF-κB inhibitor were measured by RT-qPCR. (vs VacA group, *P < 0.05, vs VacA + PBS group, #P < 0.05).
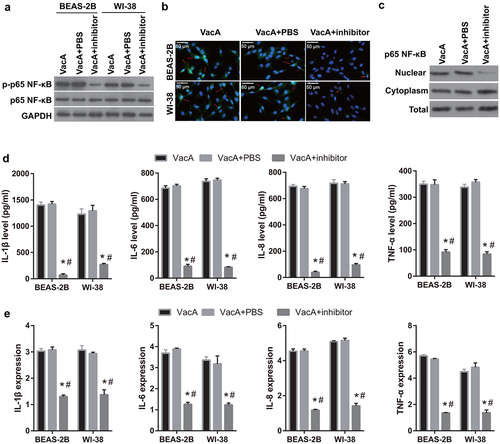
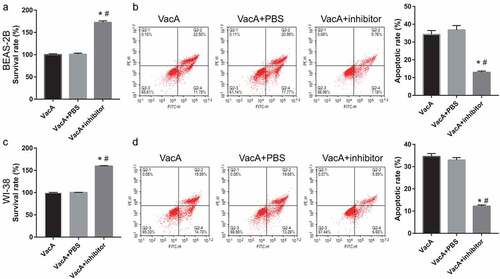
Figure 6. Alleviation of VacA-induced apoptosis and suppression of viability by the NF-κB inhibitor BAY11-7082. (a and c) Viability of WI-38 and BEAS-2B cells after VacA treatment was assessed by MTS assay. (b and d) Apoptosis of WI-38 and BEAS-2B cells after VacA treatment was assessed by flow cytometry. (vs VacA group, *P < 0.05, vs VacA + PBS group, #P < 0.05).
Supplemental Material
Download Zip (11.3 MB)Data Availability Statement
All date from this study are available in this published article.