
Figures & data
Table 1. Primers used in this study
Figure 1. TFB2M expression is positively correlated with TAM infiltration in ovarian tumor tissues A. Comparison of TFB2M/TFB1M/TFAM RNA expression in normal fallopian tube (GTEx-FT, n = 5) in GTEx project and primary ovarian cancer tissues in TCGA (TCGA-OV, n = 418). B-C. K-M survival analysis of PFS (b) and OS (c) in patients with primary ovarian cancer, using data from Kaplan-Meier Plotter. Patients were grouped by the auto select best cutoff of TFB2M expression. D. IHC staining of TFB2M in the normal fallopian tube and primary ovarian cancer tissues in the HPA dataset. Images were retrieved from the following links: https://www.proteinatlas.org/ENSG00000162851-TFB2M/tissue/fallopian+tube and https://www.proteinatlas.org/ENSG00000162851-TFB2M/pathology/ovarian+cancer#ihc. E-F. Representative IHC staining images of TFB2M and CD163 in serial ovarian cancer tissue arrays (e). Correlation between TFB2M expression and percentage of CD163+ cells in 68 ovarian cancer tissues (f). Patients were divided into four groups by the quartile value of TFB2M staining or percentage of CD163+ cells. Spearman’s correlation analysis was conducted. OVC: ovarian cancer. FT: fallopian tube. *p < 0.05, ***p < 0.001.
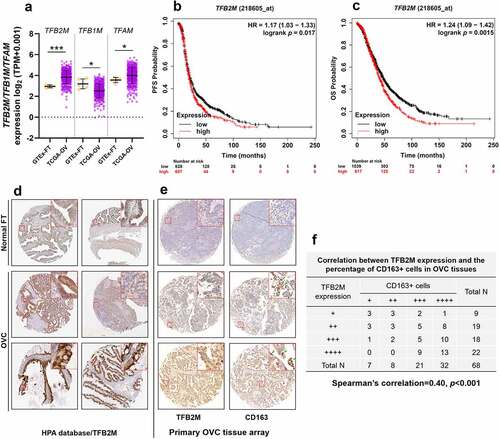
Figure 2. TFB2M expression is positively correlated with cytosolic mtDNA stress in ovarian cancer cells A-B. QRT-PCR (top panels) and western blot (bottom panels) analysis of TFB2M expression at the mRNA and protein levels in OVISE and CAOV4 cells 48 h after lentiviral infection for TFB2M overexpression (a) or knockdown (b). C. Fluorescent detection was performed to visualize double-strand DNA (green, using PicoGreen) and mitochondria (red, using MitoTracker) in OVISE and CAOV4 cells 48 h after lentiviral infection for TFB2M overexpression. Cytosolic mtDNA was indicated by white arrows. D-E. qPCR was used to determine the copy number of mtDNA in the cytoplasm of OVISE and CAOV4 cells 48 h after lentiviral infection for TFB2M overexpression (d) or knockdown (e). Data shown are the mean ± SD. from three independent experiments. EV: empty vector; shTFB2M: TFB2M shRNA; scr.: shRNA scramble control. **p < 0.01, ***p < 0.001.
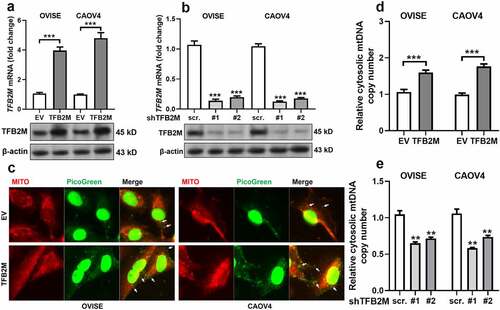
Figure 3. Cytosolic mtDNA stress enhances the secretion of IL-6 by activating the nuclear factor-κB (NF-κB) signaling pathway A-B. qRT-PCR analysis for the mRNA expression of genes encoding TAM recruitment associated cytokines and chemokines including CCL2, CSF1, TGF-β, IL-6, and CCL22 in OVISE (a) and CAOV4 (b) cells 48 h after lentiviral mediated TFB2M overexpression. C-D. qRT-PCR (c) analysis of IL-6 transcription in cells and ELISA (d) assay of IL-6 secretion in the supernatants of cultured OVISE and CAOV4 cells with TFB2M overexpression alone, treated with DNase I alone or with combined TFB2M overexpression and DNase I treatment. E. qPCR was used to determine the copy number of mtDNA in the cytoplasm of OVISE and CAOV4 cells with TFB2M overexpression alone, treated with DNase I alone or with combined TFB2M overexpression and DNase I treatment. F. Immunofluorescent staining of TLR9 in OVISE and CAOV4 cells with or without TFB2M overexpression. The interactions between TLR9 and cytosolic mtDNA were indicated by white arrows. G-J. Western blot analyses were performed to detect the protein levels of TFB2M in whole cells and phospho-NF-κB p65 (p-p65) (Ser536) and p65 in the cytoplasm and nucleus of OVISE and CAOV4 cells with TFB2M overexpression alone or with combined ODN INH-18 (a TLR9 antagonist), DNase I or PDTC (an NF-κB inhibitor) treatment. Total TFB2M, nucleus p-p65, and p65 in each group were quantified using ImageJ software (h-j). Data shown are the mean ± SD. from three independent experiments. EV: empty vector. **p < 0.01, ***p < 0.001, n.s., not significant.
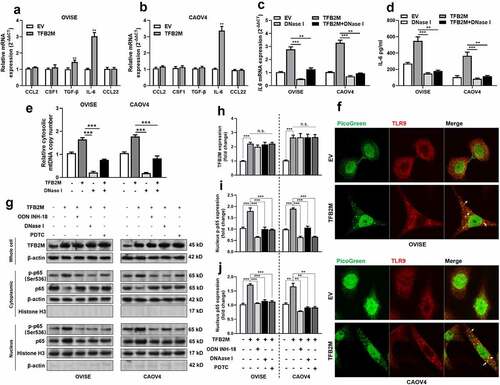
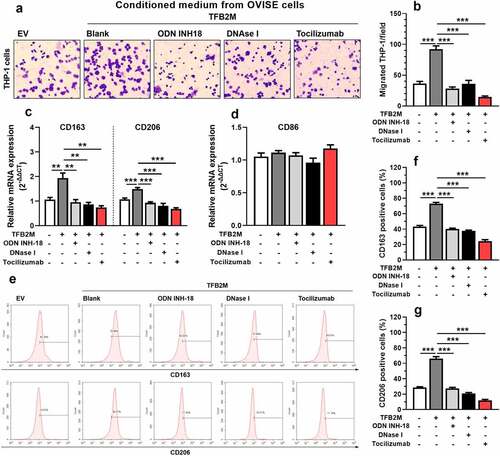
Figure 4. TFB2M overexpression induced cytosolic mtDNA stress enhances macrophage infiltration and M2 polarization by IL-6 in ovarian cancer A-B. Representative images (a) and quantitation (b) of transwell migration assay of THP-1 cells by conditioned medium from OVISE cells as indicated. In the Tocilizumab group, cells were pretreated with 2 μg/ml Tocilizumab for 12 h. C-D. qRT-PCR analysis was performed to detect the expression of M2 macrophage markers (CD163 and CD206) (c) and M1 macrophage markers (CD86) (d) at the mRNA level in THP-1 macrophages treated with different conditioned mediums as in panel A. E-G. Representative images (e) and quantitation (f-g) of flow cytometric analysis to detect the proportion of CD163+ (e-f) or CD206+ (e and g) THP-1 macrophages treated with different conditioned mediums as in panel A. Data shown are the mean ± SD. from three independent experiments. **p < 0.01, ***p < 0.001.
Data availability statements
All data generated or analyzed during this study are included in this published article.