Figures & data
Figure 1. Upregulation of metastasis-associated lung adenocarcinoma transcript 1 (MALAT1) expression suppresses cell proliferation. (a) Quantitative reverse transcription-polymerase chain reaction (qRT-PCR) assay was used to determined MALAT1 expression levels when human vascular endothelial cells (HUVECs) were transfected with the control-plasmid or MALAT1-plasmid for 48 h. (b) 3-(4,5-dimethylthiazol-2-yl)-2,5-diphenyl tetrazolium bromide (MTT) assay of cell viability. (c) Bcl-2-associated X (Bax) and Bcl-2 protein expression levels were determined via western blotting analysis. (d) The ratio of Bax/Bcl-2 is shown. qRT-PCR assay was used to measure Bax (e) and Bcl-2 (f) mRNA expression levels. (g) Flow cytometry (FCM) assay was performed to detect cell apoptosis. (h) Apoptosis rate of HUVECs.
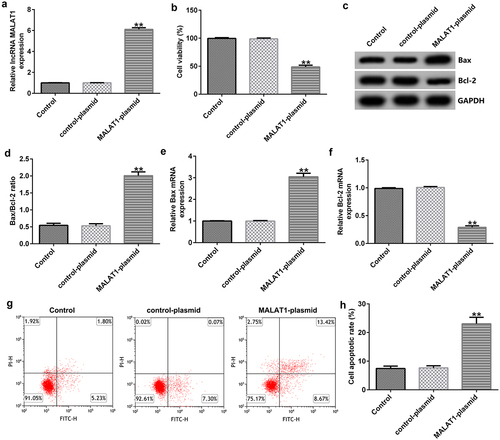
Figure 2. Binding of long non-coding RNA (lncRNA) MALAT1 with microRNA (miR)-383-5p. (a) Interaction between miR-383-5p and 3ʹ-untranslated region (UTR) of MALAT1 was predicted using the starbase prediction software. (b) Dual luciferase reporter gene assay was used to verify the interaction between MALAT1 and miR-383-5p when 293 T cells were co-transfected with the miR-383-5p mimic and wild-type or mutant MALAT1 3ʹ-UTR reporter.
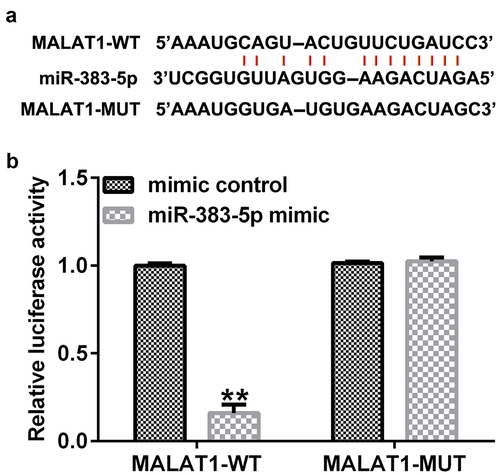
Figure 3. MALAT1 negatively regulates miR-383-5p expression levels in HUVECs. (a). qRT-PCR assay was used to determine MALAT1 expression levels when HUVECs were transfected with the control-small interfering RNA (siRNA) or MALAT1-siRNA. (b) qRT-PCR assay was used to determine miR-383-5p expression levels when HUVECs were transfected with the inhibitor control or miR-383-5p inhibitor. (c) qRT-PCR assay was used to determine miR-383-5p expression levels when HUVECs were transfected with the control-siRNA, MALAT1-siRNA, MALAT1-siRNA + inhibitor control or MALAT1-siRNA + miR-383-5p inhibitor for 48 h.
Figure 4. MALAT1-siRNA increases the viability and inhibits the apoptosis of HUVECs by upregulating miR-383-5p expression levels. (a) MTT assay to determine cell viability. (b) Bax and Bcl-2 protein expression levels were determined via western blotting analysis. (c) The ratio of Bax/Bcl-2 is shown. (d) qRT-PCR assay was used to determine Bax and Bcl-2 mRNA expression levels. (e) FCM assay was performed to detect cell apoptosis. (f) Apoptosis rate of HUVECs.
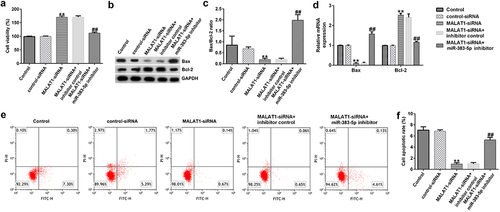
Figure 5. Targeting relationship between miR-383-5p and BCL2-like 11 (BCL2L11). (a) Starbase analysis was used to predict the relationship between miR-383-5p and BCL2L11. (b) Binding relationship of miR-383-5p and BCL2L11 was confirmed using the dual-luciferase reporter assay.
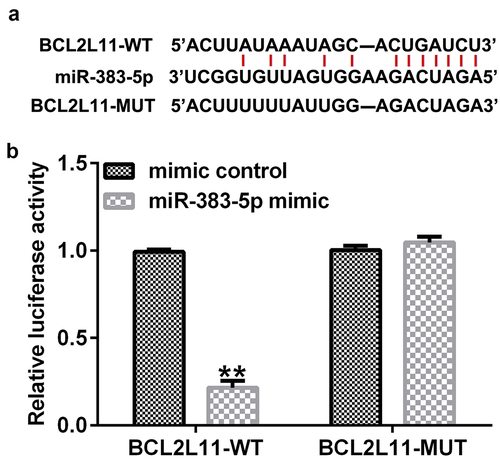
Figure 6. miR-383-5p negatively regulates BCL2L11 expression levels in HUVECs. (a) qRT-PCR assay was used to determine miR-383-5p expression levels when HUVECs were transfected with the miR-383-5p mimic. (b) qRT-PCR assay was used to determine BCL2L11 expression levels when HUVECs were transfected with the BCL2L11-plasmid. (c) qRT-PCR assay was used to determine BCL2L11 expression levels when HUVECs were transfected with the mimic control, miR-383-5p mimic, miR-383-5p mimic + control-plasmid, or miR-383-5p mimic + BCL2L11-plasmid. (d) BCL2L11 expression levels were determine using western blot analysis.
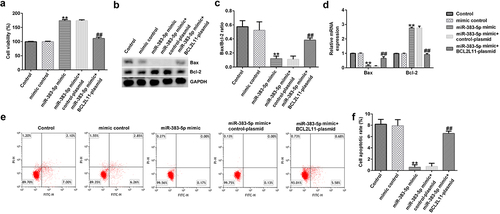
Figure 7. miR-383-5p improves the viability and decreases the apoptosis of cells by downregulating BCL2L11 expression levels. (a) MTT assay to detect cell viability. (b) Bax and Bcl-2 protein expression levels were determined via western blotting analysis. (c) The ratio of Bax/Bcl-2 is shown. (d) qRT-PCR assay was used to determine Bax and Bcl-2 mRNA expression levels. (e) FCM assay was performed to detect cell apoptosis. (f) Apoptosis rate of HUVECs.