Figures & data
Figure 1. PF inhibits the proliferation and invasion of HRCECs. (a) HRCECs were treated with PF (0.5, 5, or 15 µM) for 24 h and the cell viability was detected with CCK8. (b) HRCECs were treated with 5 µM of PF for 24, 48, or 72 h and the cell viability was detected with CCK8. (c, d) HRCECs were treated with PF (0.5, 5, or 15 µM) for 24 or 48 h. The migration ability of cells was measured with wound healing assay. (e, f) HRCECs were treated with PF (0.5, 5, or 15 µM) for 24 h, the migration ability of cells was explored with transwell assay. *P < 0.05, **P < 0.01 compared with the control group; n = 3.
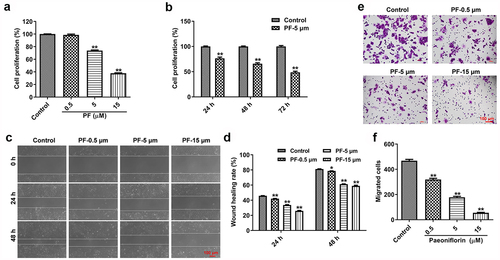
Figure 2. PF inhibits the angiogenesis of HRCECs under both normoxia and hypoxia. (a) HRCECs were treated with PF (0.5, 5, or 15 µM) for 24 h under normoxia, the angiogenesis ability of cells was detected with tube formatting assay. (b) HRCECs were treated with PF (0.5, 5, or 15 µM) for 24 h under hypoxia, the angiogenesis ability of cells was detected. *P < 0.05, **P < 0.01 compared with the control group; n= 3.
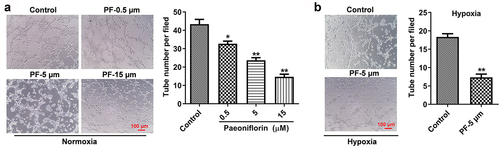
Figure 3. PF is able to reverse hypoxia-induced upregulation of VEGFA, HIF-1α, and p-STAT3 in HRCECs. (a, b) HRCECs were treated with PF (0.5, 5, or 15 µM) for 24 h under normoxia, the level of VEGFA in cell supernatant was detected with ELISA kit. The gene expression of VEGFA and HIF-1α in cells was measured with RT-qPCR. (c, d) HRCECs were treated with PF (5 µM) for 24 h under hypoxia, the level of VEGFA in cell supernatant was detected with ELISA kit. The gene expression of VEGFA and HIF-1α in cells was measured with RT-qPCR. (e, f) HRCECs were treated with PF (5 µM) or/and hypoxia for 24 h, the protein p-STAT3, STAT3, VEGFA, and HIF-1α expression in HRCECs was detected with western blot. *P < 0.05, **P < 0.01 compared with the control group; #P < 0.05, ##P < 0.01 compared with the hypoxia group; n = 3.
Figure 4. Knockdown of HIF-1α enhanced the anti-angiogenesis effect of PF on HRCECs under hypoxia. (a) HRCECs were treated with HIF-1α siRNAs for 24 h, the level of HIF-1α was detected with RT-qPCR. (b, c) HRCECs were treated with HIF-1α siRNA3 for 24 h, the level of HIF-1α was measured with western blot. (D, E and F) HRCECs were treated with PF or/and HIF-1α siRNA3 for 24 h under hypoxia, the angiogenesis and migration of cells were detected with tube formatting or transwell assay, respectively. *P < 0.05, **P < 0.01 compared with the control group; #P < 0.05, ##P < 0.01 compared with the hypoxia group; n = 3.
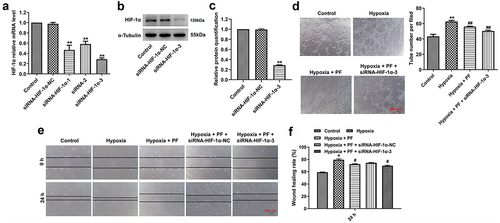
Figure 5. PF prevents the angiogenesis of HRCECs via inhibition of HIF-1α/VEGFA pathway. HRCECs were treated with PF or/and HIF-1α siRNA3 for 24 h under hypoxia. (a) The gene level of HIF-1α and VEGFA in cells was detected with RT-qPCR. (b) The level of VEGFA in cell supernatant was measured with ELISA kit. (c, d) The protein expression of p-STAT3 and VEGFA in cells was detected with western blot. (e, f) The protein expression of p-STAT3 in cells was detected with fluorescence staining. **P < 0.01; n = 3.
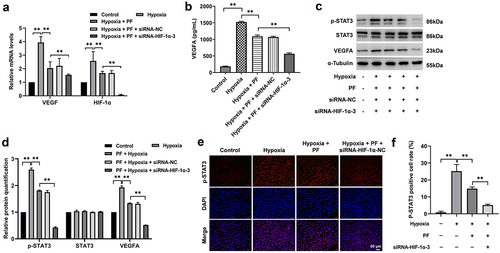
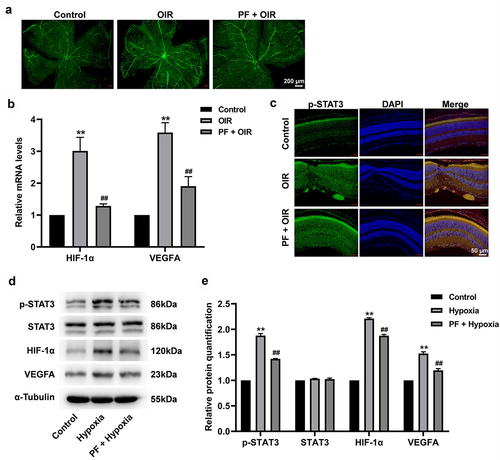
Figure 6. PF inhibits the angiogenesis in a rat model of OIR via downregulation of HIF-1α/VEGFA pathway. (a) The angiogenesis in retinal tissue was measured with FITC-dextran staining. (b) The gene expression of HIF-1α and VEGFA in retinal tissue was detected with RT-qPCR. (c) The expression of p-STAT3 in retinal tissue was measured with immunofluorescence staining. (d, e) The protein level of p-STAT3, HIF-1α, and VEGFA in retinal tissue was determined by western blot. **P < 0.01 compared with the control group; ##P < 0.01 compared with the hypoxia group; n = 3.