
Figures & data
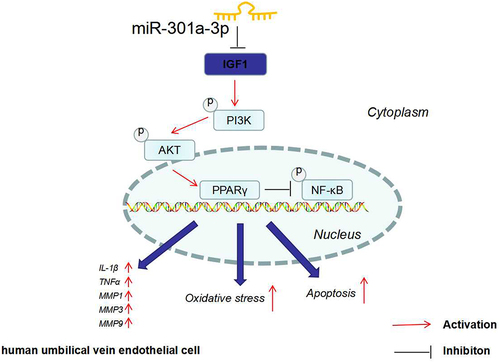
Table 1. Primer sequences of each gene.
Figure 1. IGF1 expression was elevated in the plasma of great saphenous vein varicosis patients and lower limb venous ulcer patients. Venous blood samples (5 ml) were harvested prior to surgery from normal controls, great saphenous vein varicosis patients (C1-C3), and lower limb venous ulcer patients (C4-C6). (a,b): RT-qPCR determined miR-301a-3p and IGF1 expressions in the patients’ serum. (c–g): RT-qPCR confirmed the profiles of matrix metalloproteinases (MMP1, MMP3, MMP9) and inflammatory factors (IL-1β and TNFα) in the serum of C1-C3 and C4-C6 patients. H-M: Pearson analysis examined miR-301a-3p’s correlation with IGF1, MMP1, MMP3, MMP9, IL-1β, and TNFα. N (the number of patients in each group) = 15. *P < 0.05, **P < 0.01, ***P < 0.001.
Figure 2. miR-301a-3p was up-regulated in HUVECs treated with IL-1β, H2O2, and OGD. HUVECs were treated with IL-1β, H2O2, and OGD for the construction of an in-vitro endothelial cell damage model. (a–c): MTT examined HUVEC viability. (d–f): RT-PCR determined miR-301a-3p’s expression in HUVECs treated with IL-1β/H2O2/OGD. *P < 0.05, **P < 0.01, ***P < 0.001. N (the times of repeating experiments) = 3.
Figure 3. miR-301a-3p overexpression stepped up HUVEC viability decline and apoptosis increase mediated by IL-1β, H2O2, and OGD. (a): Vascular endothelial cells were transfected with miR-NC and miR-301a-3p mimics for 24 hours. RT-PCR checked the efficiency. Then, the transfected cells were treated with IL-1β, H2O2, and OGD for 48 hours. (b–d): MTT examined HUVEC viability. (e–g): Flow cytometry tracked HUVEC apoptosis. (h–j): Western blot ascertained the profiles of apoptosis-concerned proteins (Bax, Bcl2, Caspase3) in HUVECs. *P < 0.05, **P < 0.01, ***P < 0.001. N = 3.
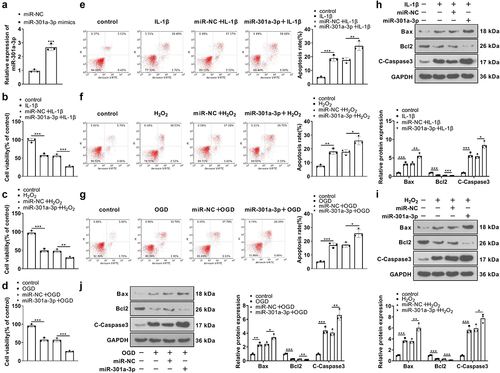
Figure 4. miR-301a-3p down-regulation ameliorated HUVEC viability decline and apoptosis increase mediated by IL-1β, H2O2, and OGD. (a): Vascular endothelial cells were transfected with in-NC and the miR-301a-3p inhibitor for 24 hours. RT-PCR confirmed miR-301a-3p expression in transfected HUVECs. The transfected cells were treated with IL-1β, H2O2, and OGD for 48 hours. (b–d): MTT examined HUVEC viability. (e–g): Flow cytometry tracked HUVEC apoptosis. (h–j): Western blot verified the profiles of Bax, Bcl2, and Caspase3 in HUVECs. *P < 0.05, **P < 0.01, ***P < 0.001. N = 3.
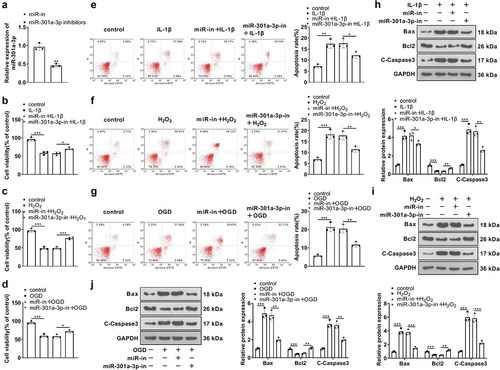
Figure 5. The influence of miR-301a-3p on HUVEC inflammation and oxidative stress mediated by IL-1β, H2O2, and OGD.Vascular endothelial cells were transfected with miR-NC, miR-301a-3p mimics, in-NC, and the miR-301a-3p inhibitor. Then, transfected HUVECs were treated with IL-1β, H2O2, and OGD for 48 hours, respectively. (a–c): RT-PCR confirmed the profiles of inflammatory factors IL-1β, TNFα, and MMP1, 3, 9 in HUVECs. (d–f): Western blot determined the profiles of inflammatory proteins COX2 and iNOS in HUVECs. (g–i): The DCFDA/H2DCFDA-Cellular ROS Assay Kit verified ROS levels in HUVECs. *P < 0.05, **P < 0.01, ***P < 0.001. N = 3.
Figure 6. miR-301a-3p suppressed the IGF1/IGF-1 R/PI3K/AKT/PPARγ pathway and up-regulated the NF-κB pathway. Vascular endothelial cells were transfected with miR-NC, miR-301a-3p mimics, in-NC, and the miR-301a-3p inhibitor. Then, transfected HUVECs were treated with IL-1β, H2O2, and OGD for 48 hours, respectively. (a–f): Western blot confirmed the profile of the IGF1/IGF-1 R/PI3K/AKT/PPARγ/NF-κB pathway in the miR-301a-3p overexpression and inhibition cell models. *P < 0.05, **P < 0.01, ***P < 0.001. N = 3.
Figure 7. The PI3K or PPARγ inhibitor weakened PI3K/AKT/PPARγ pathway activation mediated by the miR-301a-3p inhibitor. The PI3K inhibitor LY294002 (1 μM) or the PPARγ inhibitor GW9661 (3.3 nM) was taken to treat HUVECs, transfected with the miR-301a-3p inhibitor, for 24 hours. (a): MTT measured HUVEC viability. (b): Flow cytometry tracked apoptosis. (c): Western blot determined the profiles of Bax, Bcl2, and Caspase3 in HUVECs. (d): RT-PCR checked the profiles of IL-1β, TNFα, and MMP1, 3, 9 in HUVECs. (e): Western blot verified COX2 and iNOS expressions in HUVECs. (f): The DCFDA/H2DCFDA-Cellular ROS Assay Kit ascertained ROS levels in HUVECs. (g–j): The levels of SOD, GSH-PX, LDH, and MDA were examined through the SOD, GSH-PX, LDH, and MDA detection kits. (k): Western blot gauged the profile of the IGF1/IGF-1 R/PI3K/AKT/PPARγ/NF-κB pathway in HUVECs. *P < 0.05, **P < 0.01, ***P < 0.001. N = 3.
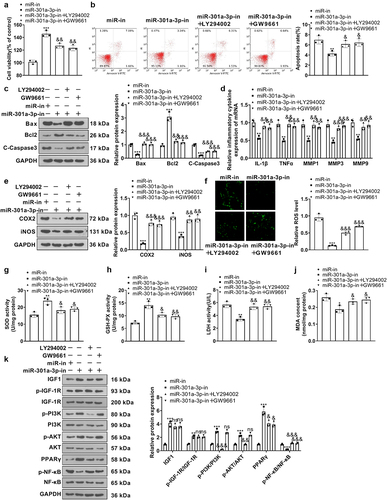
Figure 8. NF-κB inhibition attenuated damage mediated by miR-301a-3p. HUVECs transfected with miR-301a-3p mimics were treated with the NF-κB inhibitor BAY-11-7082 (1 μM) for 24 hours. (a): MTT examined cell viability. (b,c): Flow cytometry and western blot monitored HUVEC apoptosis. (d): RT-PCR confirmed the profiles of IL-1β, TNFα, and MMP1, 3, 9 in HUVECs. (e–f): Western blot determined COX2 and iNOS expressions in HUVECs. (g): The DCFDA/H2DCFDA-Cellular ROS Assay Kit ascertained ROS levels in HUVECs. (h–k): The levels of SOD, GSH-PX, LDH, and MDA were determined through the SOD, GSH-PX, LDH, and MDA detection kits. K: Western blot confirmed the profile of the NF-κB pathway in HUVECs. *P < 0.05, **P < 0.01, ***P < 0.001. N = 3.
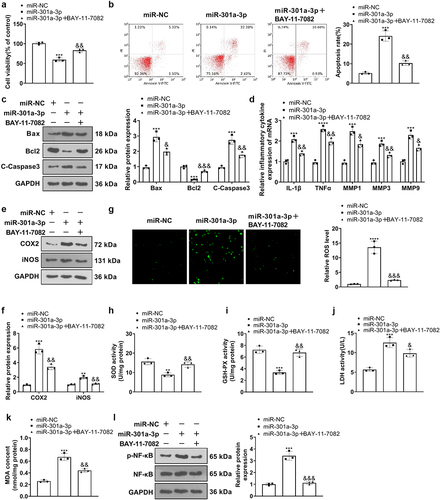
Figure 9. miR-301a-3p targeted IGF1. A-B: The wt and mt sequences of IGF1 luciferase reporter gene vectors were built. Luciferase reporter assay analyzed the luciferase activity of HUVECs transfected with miR-301a-3p mimics, miR-NC, and wt- or mt-IGF1 3’-UTR. C: RT-PCR confirmed IGF1 mRNA expression in the cell models with miR-301a-3p overexpression and inhibition. *P < 0.05, **P < 0.01, ***P < 0.001. N = 3.
Data availability statement
The data sets used and analyzed during the current study are available from the corresponding author on reasonable request.