Figures & data
Figure 1. Characterization of exosomes and FGL1 expression. (a) Morphology of purified exosomes; (b) The hydrodynamic size of the exosomes was measured using an NTA; (c) exosome markers CD9, CD63 and CD81 were detected by Western blot; (d) FGL1 expression were detected by Western blot. *p < 0.05 vs. Control group.
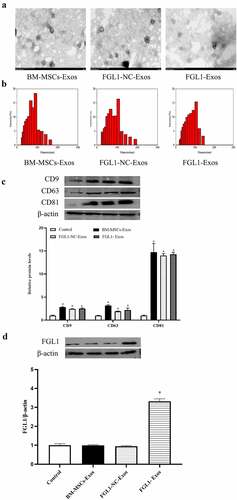
Figure 2. Overexpression of FGL1 attenuated the cell viability and apoptosis in RA-FLSs. (a) Representative fluorescence images of exosomes were englobed by FLSs; (b) Cell viability was detected by CCK-8 assay; (c) Cell apoptosis was detected by Flow cytometry. *p < 0.05 vs. Control group; #p < 0.05 vs. Model group; @p < 0.05 vs. BM-MSCs-Exos group.
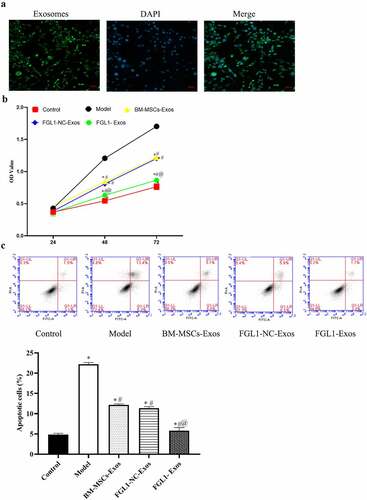
Figure 3. Overexpression of FGL1 attenuated the inflammatory cytokines and NF-κB relative protein expressions. (a) MMP-9 expression; (b) IL-1β expression; (c) IL-8 expression; (d) IL-17 expression; (e, f) p-NF-κBp65 and NF-κBp65 expressions were detected by Western blot; (g) Western blot images; (h) p-IκBα/IκBα; (i) Bcl-2/Bax; (j) cleaved-caspase 3 expression. *p < 0.05 vs. Control group; #p < 0.05 vs. Model group; @p < 0.05 vs. BM-MSCs-Exos group.
Figure 4. Overexpression of FGL1 attenuated paw and Knee arthritis scores and Knee joint histopathology in RA rat model. (a) Macroscopic images of paws; (b) Paw thickness; (c) Mean arthritis scores; (d) Knee joint histopathology were detected by HE and Safranin O stain. *p < 0.05 vs. Control group; #p < 0.05 vs. Model group; @p < 0.05 vs. BM-MSCs-Exos group.
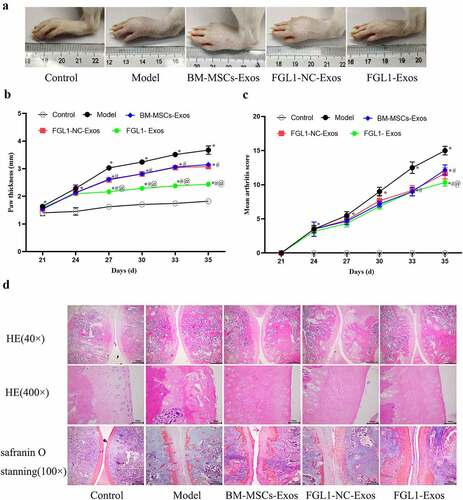
Figure 5. Overexpression of FGL1 attenuated inflammatory cytokines, specific rheumatoid markers and immunological markers expressions in RA rat model. (a) MMP-9 expression; (b) IL-1β expression; (c) IL-8 expression; (d) IL-17 expression; (e) RF expression; (f) MMP-3 expression; (g) CRP expression; (h) IgG expression. *p < 0.05 vs. Control group; #p < 0.05 vs. Model group; @p < 0.05 vs. BM-MSCs-Exos group.
Figure 6. Overexpression of FGL1 attenuated cell apoptosis and FGL1 expression in RA rat model. (a) Cell apoptosis in knee joint; (b) FGL1 expression in knee joint. *p < 0.05 vs. Control group; #p < 0.05 vs. Model group; @p < 0.05 vs. BM-MSCs-Exos group.
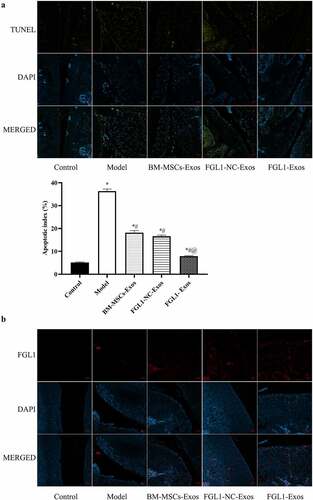
Figure 7. Overexpression of FGL1 attenuated immune organs and NF-κB relative protein expressions in RA rat model. A: Thymus indexes; B: Spleen indexes; C: Liver and thymus histopathology were detected by HE staining; *p < 0.05 vs. Control group; #p < 0.05 vs. Model group; @p < 0.05 vs. BM-MSCs-Exos group.
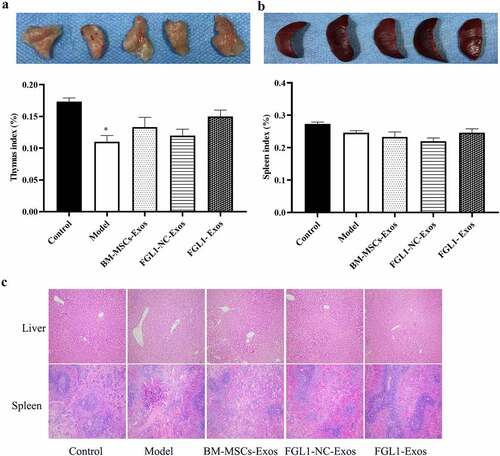
Figure 8. Overexpression of FGL1 attenuated NF-κB relative protein expressions in RA rat model. (a and b) p-NF-κBp65 and NF-κBp65 expressions were detected by Western blot; (c) Western blot images; (d) p-IκBα/IκBα; (e) Bcl-2/Bax; (f) cleaved-caspase 3 expression. *p < 0.05 vs. Control group; #p < 0.05 vs. Model group; @p < 0.05 vs. BM-MSCs-Exos group.