Figures & data
Figure 1. ARHGAP35 is downregulated in primary GC and metastatic tissues. a1-a2, The expression levels of ARHGAP35 were determined in GC tissue microarrays by immunohistochemistry. b-c, The expression score of ARHGAP35 in GC, metastatic GC and adjacent normal tissues is shown. **P < 0.05 and ***P < 0.001. d. The overall survival of patients with GC according to their ARHGAP35 expression levels was estimated by Kaplan-Meier analysis. ARHGAP35, Rho GTPase‑activating protein 35; GC, gastric cancer.
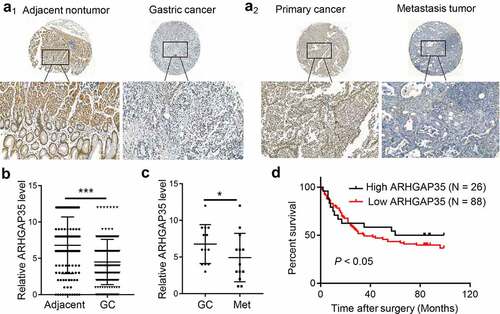
Table 1. Correlation between ARHGAP35 expression and clinicopathological parameters in GC
Figure 2. ARHGAP35 regulates GC cell motility in vitro. a-b, The mRNA and protein expression levels of ARHGAP35 in BGC823 and AGS cells were determined by western blot analysis and reverse transcription-quantitative PCR. *P < 0.05 and **P < 0.01. c-d, The migration and invasion capacities of ARHGAP35-depleted or -overexpressing GC cells were assessed by Transwell assays. d-f. The width of the wound was quantified by cell wound healing assay. **P < 0.01 and ***P < 0.001. ARHGAP35, Rho GTPase‑activating protein 35.

Figure 3. ARHGAP35 regulates cytoskeletal reorganization and epithelial-to-mesenchymal transition by targeting RhoA and E-cadherin, respectively. a-b, GC cell cytoskeleton staining was performed using phalloidin. c, The protein expression levels of RhoA and GTP-RhoA were detected by western blot analysis. d, The protein expression levels of e-cadherin were determined in ARHGAP35-depleted or -overexpressing GC cells using western blot analysis. e-f: The expression of the epithelial marker, e-cadherin, in GC cells was assessed by immunofluorescence staining. ARHGAP35, Rho GTPase‑activating protein 35; GC, gastric cancer.
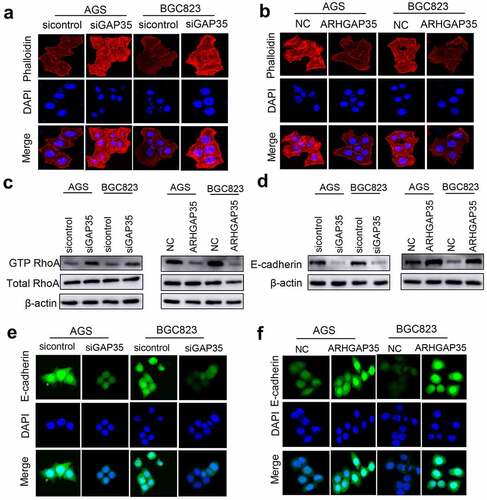
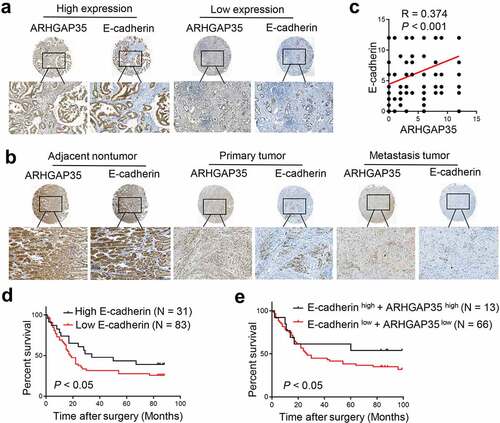
Figure 4. Simultaneous ARHGAP35 and E-cadherin downregulation is associated with poor prognosis in patients with GC. a-b-, The expression levels of ARHGAP35 and E-cadherin were determined in tissue microarrays by immunohistochemistry. c, A positive association between the expression of ARHGAP35 and E-cadherin was revealed in GC. d, E-cadherin downregulation was associated with poor prognosis in patients with GC. e, The association between ARHGAP35/E-cadherin co-expression and overall survival in patients with GC is shown. ARHGAP35, Rho GTPase‑activating protein 35; GC, gastric cancer.