
Figures & data

Table 1. Biochemical composition of EPS from Glossomastix sp. RCC3707 and RCC3688.
Table 2. Oligosaccharide sequences identified by ultra-high-pressure liquid chromatography-mass spectrometry untargeted in-source fragmentation (UHPLC-MS2) from EPS-3707.
Figure 1. Elution profiles of EPSs (LiNO3 at 0.1 mol L−1): Light Scattering signal (LS), dash line curves; Differential Refractive Index (DRI), full line curves; and molar mass distributions.
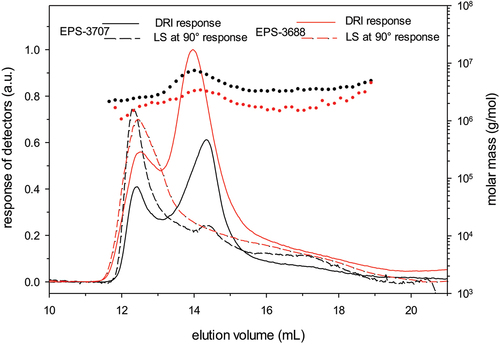
Figure 2. a) Viscosity of EPS-3707 (upward: fill circles; downward: blank circles) b) elastic and viscous moduli of EPS-3707 (G’ fill and G’’ blank circles) c) viscosity of EPS-3688 (upward: fill circles; downward: blank circles) d) elastic and viscous moduli of EPS-3688 (G’ fill and G’’ blank circles) colour for the symbols : 20 g L−1 (red), 10 g L−1 (blue), 5 g L−1 (green), 1 g L−1 (black) and 0.5 g L−1 (pink) in water at 25°C.
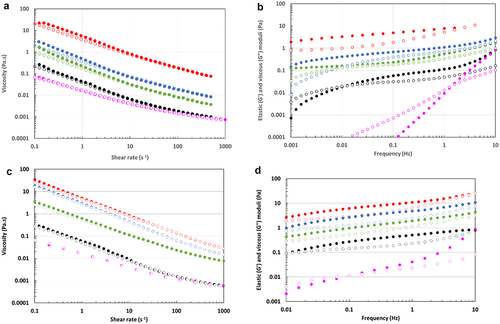
Table 3. Comparison between the yield stress (σ0) and the limit stress (σlim) and characteristics at the cross point for the two EPSs at different concentrations in water at 25°C.
Figure 3. Flow curves : effect of salinity on viscosity of a) EPS-3707 and b) EPS-3688 solutions for various concentrations in water and NaCl 0.15M; c) effect of NaCl concentration on viscosity of EPS-3707 at 1 g L−1; d) effect of salt nature on viscosity of EPS-3707 solutions at 1 g L−1; e) effect of salt nature on viscosity of EPS-3688 solutions at 5 g L−1 in water, KSCN 0.2 mol L−1 and NaCl 0.2 mol L−1.
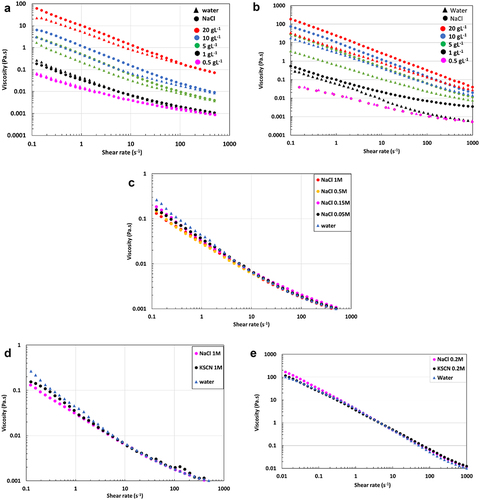
Figure 4. Effect of salinity on oscillation measurements. Left axis: elastic and viscous moduli, right axis: complex viscosity versus frequency of a) EPS-3707 1 g L−1 in water and NaCl 0.15 mol L−1; b) EPS-3707 5 g L−1 in water and NaCl 0.15 mol L−1; c) of EPS-3688 1 g L−1 in water and NaCl 0.15 mol L−1; d) of EPS-3688 5 g L−1 in water and NaCl 0.2 mol L−1; G’ (fill circle); G’’ (blank circle); complex viscosity (fill triangle).
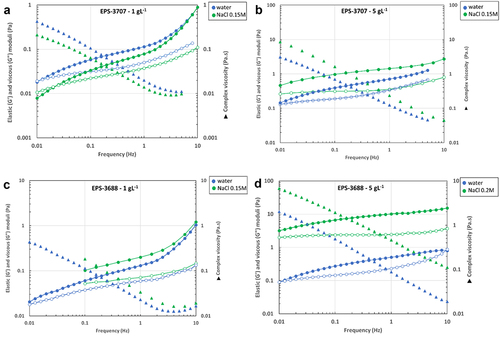
Figure 5. Restructuration of weak gel from EPS-3707 after high shear rate treatment at 25°C. Measurement at 0.1 Hz in the linearity domain a) 20 g L−1 in water b) 20 g L−1 in NaCl 0.15 mol L−1 c) 1 g L−1 in NaCl 1 mol L−1.
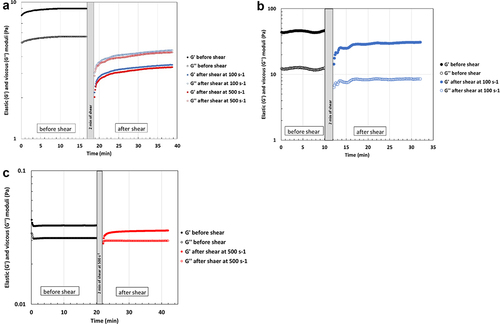
Table 4. The EI and SLB values of EPSs and alginate solutions in water at 1 g/L in function of temperature.
Table 5. The EI values (x 104 (nm−2)) of EPS-3688 solutions in water in function of concentration and temperature.
Figure 6. Elastic (G’) and viscous (G’’) moduli versus time at 25°C (blue), 37°C (red) and 60°C (green), of water solution EPS-3688 at 1 g L−1, at 1Hz and oscillation stress 0.01Pa.
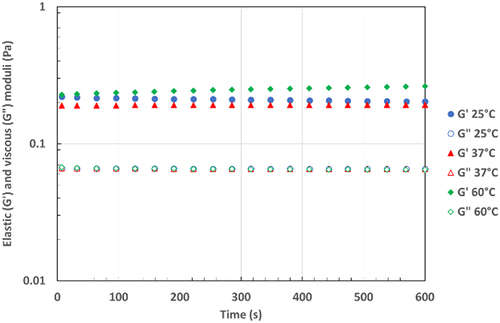
Figure 7. Percentage of transmission (y-axis) as a function of the height of the tube (x-axis) and time (curves from purple at t=0 to green and red at tmax) for a) suspensions of microcrystalline cellulose in pure water; b) suspensions of microcrystalline cellulose in EPS-3688 1 g L−1; c) suspensions of microcrystalline cellulose in alginate 10 g L−1; d) suspensions of microcrystalline cellulose in EPS-3707 1 g L−1.
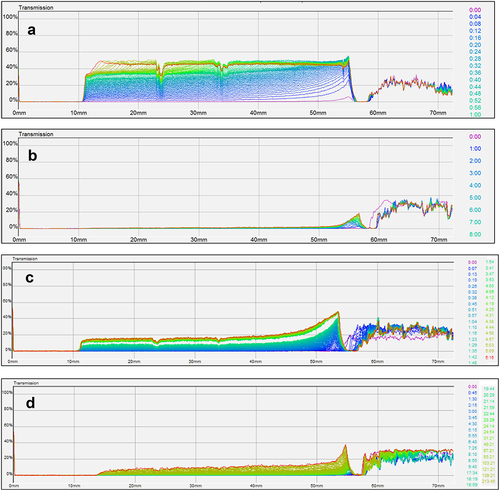
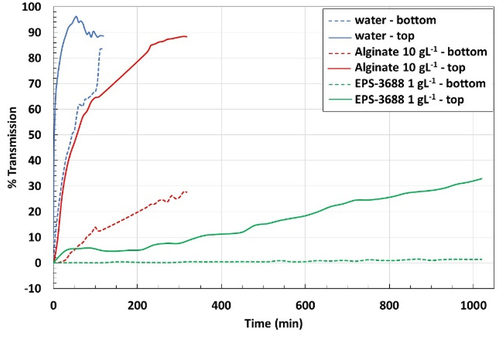
Figure 8. Percentage of transmission with ageing time of suspensions of microcrystalline cellulose.
dulong et al supplementary information.docx
Download MS Word (1.4 MB)Data availability statement
The authors confirm that the data supporting the findings of this study are available within the article and its supplementary materials, and may be shared upon request.