Figures & data
Figure 1. Deformation of lattices with a homogeneous distribution of grains. (a) A representative case of the microstructure after the relaxation (before applying a tensile stress). Grain boundaries, dislocations and stacking faults are shaded in light gray. (b) Stress–strain curves for different grain sizes. (c) The atomic configuration at the onset of the softening stage. A few dislocations that are emitted into the matrix can be observed.
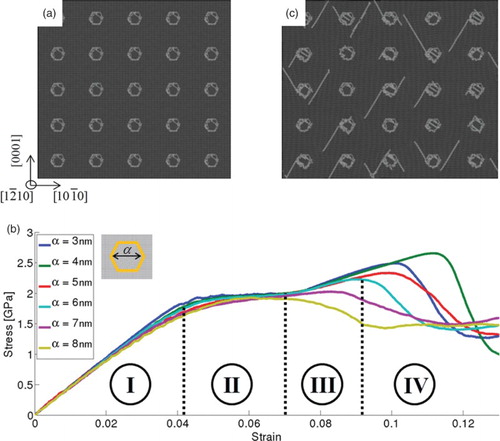
Figure 2. Deformation of lattices with a directional arrangement of grains. (a) Stress–strain curves for different directions. The angle of the grain alignment is measured from the horizontal axis ([10¯ 10] direction). Von-Mises local shear strain maps at total tensile external strain of 10% for grains aligned along angles of (b) 0° ([10¯ 10] direction) and (c) 60° (near [10¯ 12] direction) are shown. A clear strain localization is identified in the latter case.
![Figure 2. Deformation of lattices with a directional arrangement of grains. (a) Stress–strain curves for different directions. The angle of the grain alignment is measured from the horizontal axis ([10¯ 10] direction). Von-Mises local shear strain maps at total tensile external strain of 10% for grains aligned along angles of (b) 0° ([10¯ 10] direction) and (c) 60° (near [10¯ 12] direction) are shown. A clear strain localization is identified in the latter case.](/cms/asset/2c01a6de-edeb-4ac7-895c-ed7bfbe507db/tmrl_a_957791_f0002_c.jpg)
Figure 3. Two representative cases of an inhomogeneous distribution of the NGs with (a) a diffuse and (b) a strong localization. The colors correspond to the Von-Mises local shear strain, at an external tensile strain slightly above the failure strain. For convenience, the atoms within grain boundaries are shaded in light blue on the shear strain maps.
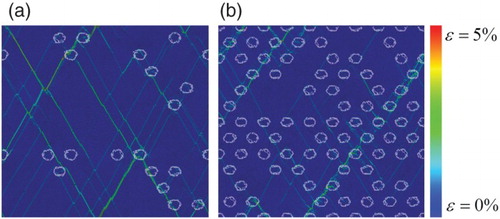
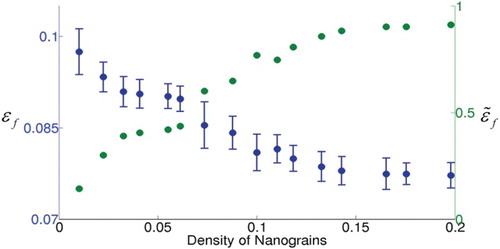
Figure 4. The failure strain and a dimensionless normalized value as a function of the density of NGs. The plot, which summarizes all 320 simulations, shows that failure strain is decreasing with an increase in the density of grains, and above a certain threshold the failure strains become microstructure- independent. This threshold can be viewed as a percolation threshold.