Figures & data
Figure 1. Structure factor of Co67B33 as a function of temperature (T) measured by in situ high-temperature XRD.
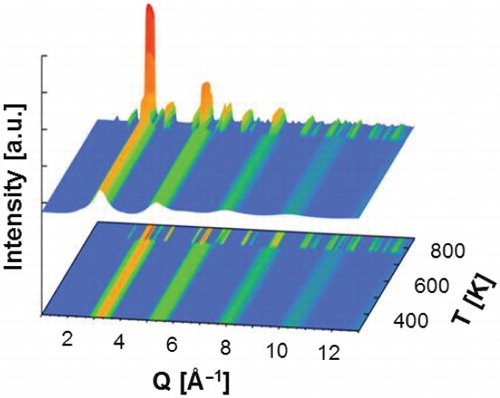
Figure 2. Comparison between the in situ measured and ab intio MDs, total pair distribution data in the temperature range of 300–700 K. For better comparison, curves are vertically offset.
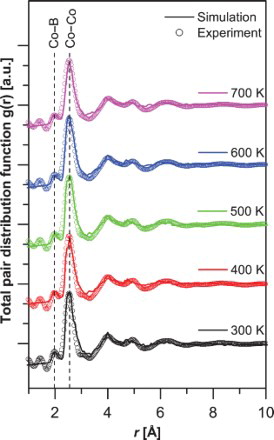
Figure 3. The atomic Co–B (left panel) and B–B (right panel) partial PDF data obtained by ab inito MDs simulation in the temperature range of 300–1,600 K are shown. The vertical lines correspond to the square and the triangular symbol indicates the location of the first and second B–B coordination shell, respectively.
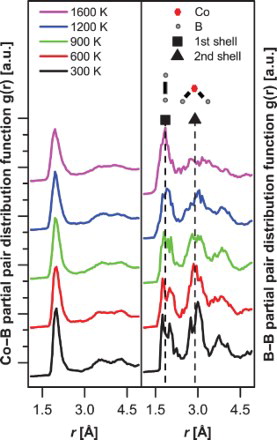
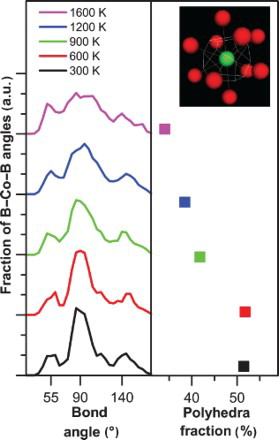
Figure 4. The bond angle distribution of the B–Co–B bonds in the temperature range of 300–1,600 K obtained by ab initio MDs simulation is shown (left panel). The fraction of Frank–Kasper-like Voronoi polyhedra is shown in the same temperature range (right panel). Furthermore, an example of the most dominant boron-centred bicapped square Archimedean antiprism, with the Voronoi index of (0,2,8,0), is given in the upper right corner.