Figures & data
Figure 1. Bright-field TEM images of typical microstructures of NC Cu, Cu–5 at% Al alloy and Cu–15 at% Al alloy.
Table 1. The grain size, tensile and fatigue properties of NC Cu and NC Cu–Al alloys processed by ECAP [16] and HPT.
Figure 2. (a) Tensile engineering stress–strain curves of NC Cu and Cu–Al alloys; (b) the evolution of ultimate tensile strength and uniform elongation with Al content; (c) dependence of fatigue lives (2Nf) on the stress amplitudes of NC Cu and Cu–Al alloys and (d) the evolution of fatigue strength coefficient and fatigue strength exponent b in the Basquin equations with the Al content in NC Cu and Cu–Al alloys.
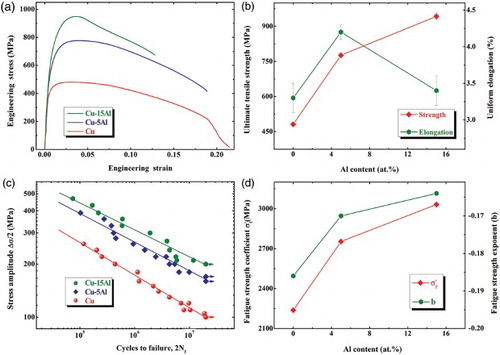
Figure 3. (a–c) The TEM micrographs of post-deformation microstructures and (d–f) SEM images of surface damage morphology of the NC Cu and Cu–Al alloys fatigued at the constant stress amplitudes of .
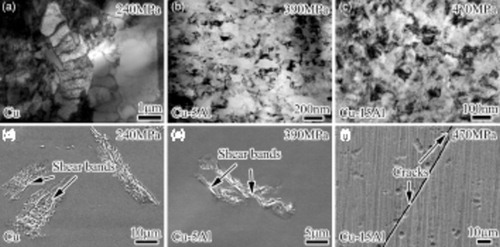
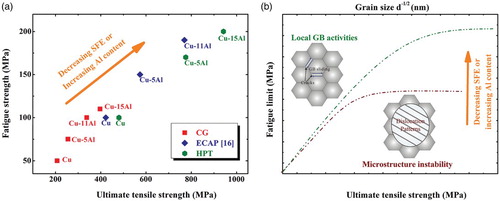
Figure 4. (a) Relationship between ultimate tensile strength and fatigue strength of pure Cu and Cu–Al alloys, showing that the tensile strength and fatigue limits can be simultaneously increased with lowering of the SFE or increasing the Al content in Cu and Cu–Al alloys; (b) schematic of relationship between ultimate tensile strength and fatigue strength in Cu and Cu–Al alloys showing that the fatigue strength cannot constantly increase with ultimate tensile strength due to different fatigue damage micromechanisms.