Figures & data
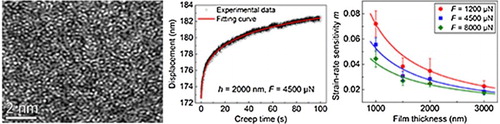
Figure 1. XRD patterns for the Cu–Zr films with different film thickness h.
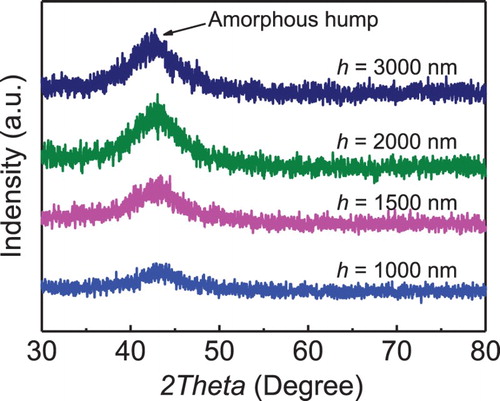
Figure 2. Representative HRTEM (a) and SADP (b) images of as-deposited Cu–Zr film with h = 2000 nm. Typical EDX mapping analysis for the Cu–Zr film (c,d) shows a uniform distribution of constituent elements. The atom percentages of Cu and Zr in the MG film are inserted in (d).
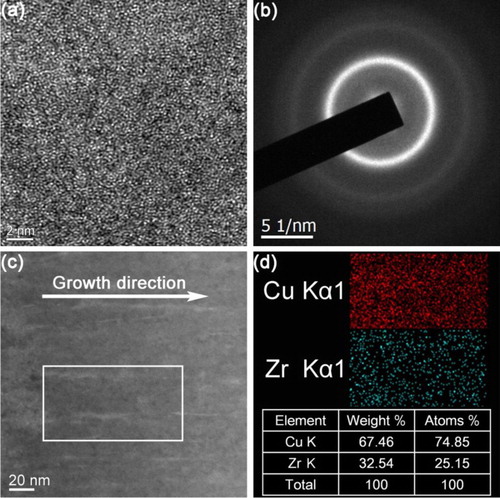
Figure 3. Representative load–depth curves of the Cu–Zr film with h = 1000 nm at different holding loads (a) and with different h at a constant holding load of 4500 μN (b).
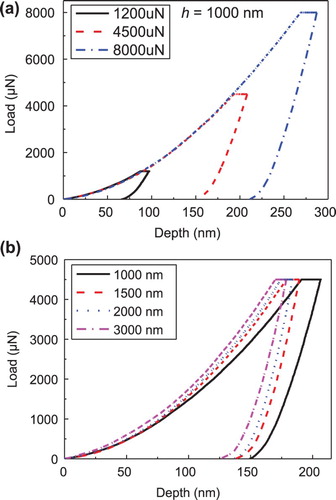
Figure 4. (a) Representative experimental results and fitting curve of h = 2000 nm Cu-Zr MG film. (b) Fitting creep responses for Cu–Zr films with different h. (c) Representative creep strain rate as a function of creep time for h = 1500 nm Cu–Zr film at different holding loads. (d) Example of the experimental method to determine the SRS.
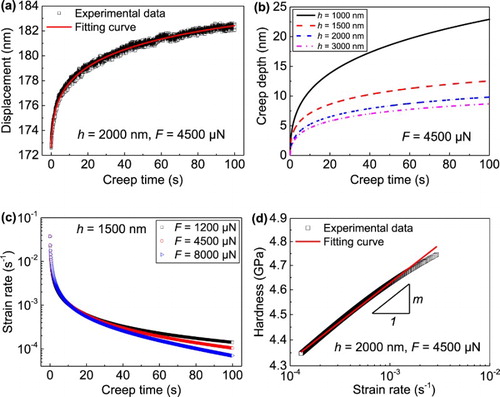
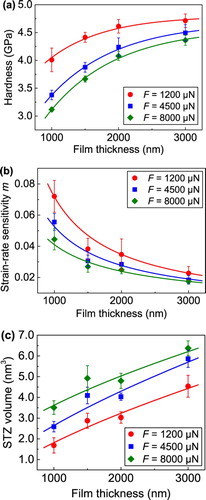
Figure 5. Experimental results of nanoindentation hardness (a), strain-rate sensitivity m (b) and STZ volume (c) as a function of h for the Cu–Zr films at different holding loads.