Figures & data
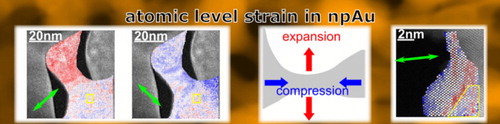
Figure 1. Lattice strain of an approximately cylindrical ligament with its cylinder axis oriented parallel to the direction in sample B. (a) Lattice strain in
-direction (radial direction) indicating tensile strain in the cylindrical region, (b) lattice strain in
-direction (along the ligament axis) indicating compressive strain, (c) shear strain, (d) rotation of the crystal lattice. All quantities have been measured with respect to the reference region marked by the yellow rectangles.
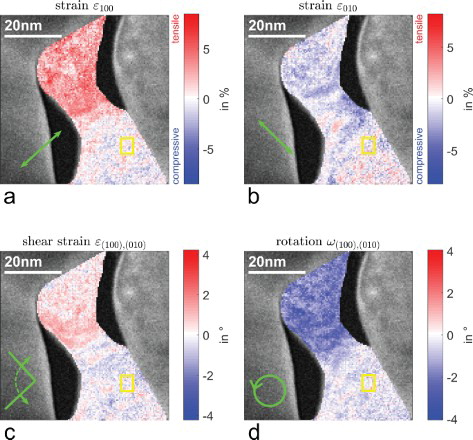
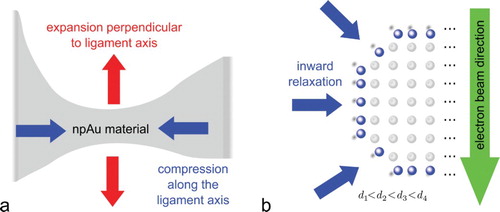
Figure 2. Tetragonal distortion of approximately cylindrical ligaments. Independent on the sample preparation ligaments show compressive lattice strain along the ligament axis and tensile strain in radial direction. (a) sample C, (b) sample A, and (c) sample B (same position as in Figure ).
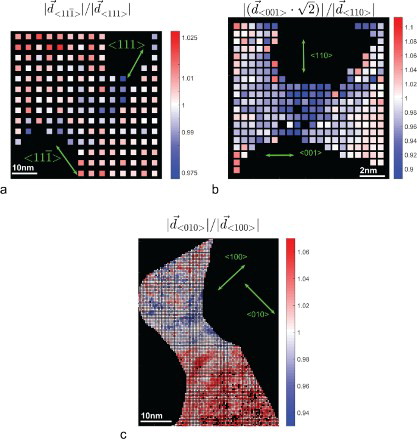
Figure 3. Atomically resolved measurement of surface relaxations of npAu (sample A) showing strengthening inward relaxation from the thick region toward the border to the vacuum. Relaxations in two different crystallographic directions (indicated by green arrows) have been determined from two different STEM images with a rotation of the scan direction between the acquisition in order to avoid an influence of scan distortions. Each data point represents atomically resolved the lattice parameter variation with respect to the lattice parameter in the yellow marked reference regions.
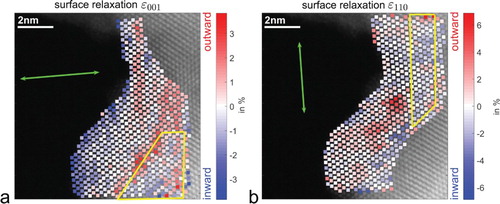
Figure 4. Crystal lattice strain in npAu: (a) Cylindrical ligaments show compressive lattice strain along the ligament axis and tensile strain in radial direction. (b) Inward surface relaxation. Averages over the lattice parameters along the path of the electron beam through the sample are decreasing toward the surface.