Figures & data
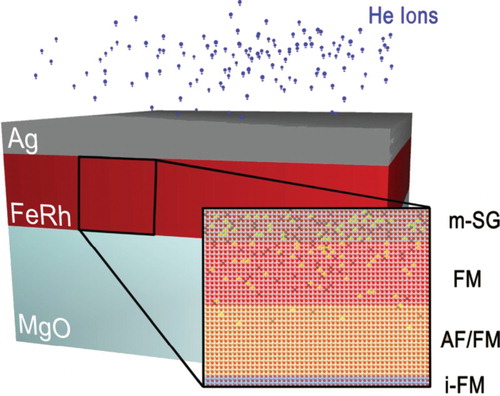
Figure 1. (a) Schematic diagram showing layered structure in gradient-dosed samples obtained from PNR measurements (m-SG = mesoscale spin glass, FM = ferromagnetic ordering, AF/FM = antiferromagnetic/ferromagnetic switchable metamagnetic ordering, i-FM = interfacial ferromagnetic ordering. (b) SQUID measurements of magnetization as a function of temperature for samples before and after He irradiation with varying doses. Arrow shows increasing background ferromagnetism with increased irradiation dose (c) (axis on the left-hand side) out-of-plane lattice constant c-parameter evolution as a function of dose measured by XRD (black squares); (axis on the right-hand side). Decreasing transition temperature with He-dose (blue triangles). Dashed lines show linear trend of c-parameter with dose in the two (AF/FM) magnetic phases.
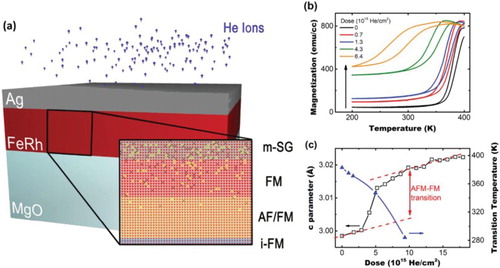
Figure 2. (a) PNR reflectivities of virgin (undosed) samples of FeRh grown on MgO 300 K (below metamagnetic transition) and 450 K (above metamagnetic transition). Blue lines show fit through the data. Overlaid red and blue error bars show data points for positive and negative neutron polarizations, respectively. (b) MSLD and NSLD depth profiles of a virgin FeRh film extracted from fits to data in Figure (a). (c) PNR reflectivity of FeRh sample after He-ion irradiation at 400 K (above transition), 330 K (within the transition region), and 200 K (below the transition). (d) MSLD and SLD depth profiles of irradiated FeRh film taken from fits in Figure (c).
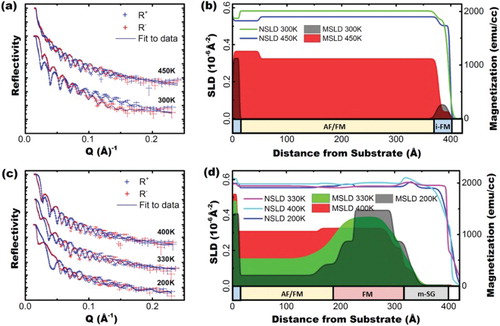
Figure 3. (a) PNR reflectivities of a gradient-dosed FeRh sample (same as from Figure (b,c)) after a 3 h 400 K anneal taken at the same temperatures. Blue lines show fits to the data. Overlaid red and blue error bars show positive and negative neutron polarizations, respectively. (b) MSLD and NSLD depth profiles extracted from fits to data shown in (a). (c) SQUID data showing comparison of irradiated FeRh film before and after annealing. Dashed lines indicate temperatures at which PNR in Figure (b) were performed (d) 200 K comparison of SLD and MSLD depth profiles before and after anneal. Arrows show migration of an FM region to the surface of the sample and decrease in magnetization magnitude, as the irradiation-induced defects are being annealed.
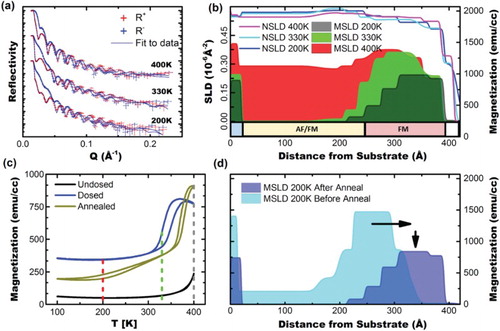
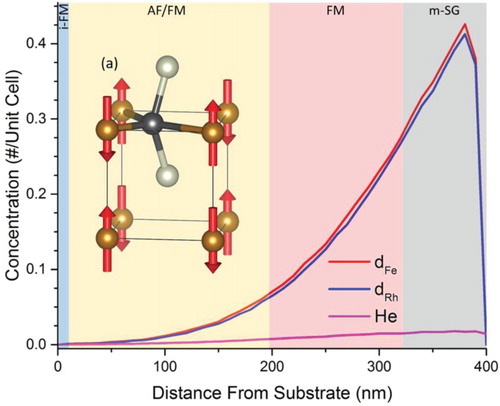
Figure 4. Concentration of Fe and Rh atoms displaced into interstitial positions and of He ions stopped in the bulk, as a function of distance from the substrate (0 Å is the interface with the MgO substrate and at 390 Å is the interface with the capping Ag layer), as simulated by TRIM/SRIM modeling. (a) Sketch shows an example of magnetic disorder introduced by a displaced Fe atom (black ball). The brown balls indicate surrounding Fe atoms which assume the overall antiferromagnetic order, and the silver ones are Rh (sketch assumes zero lattice relaxation).