Figures & data
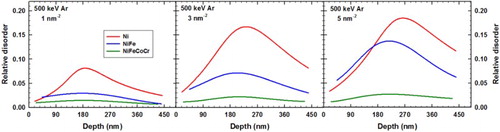
Table 1. Ion fluence range for 500 keV Ar2+ irradiation at 16 K on Ni, NiFe, and NiFeCoCr.
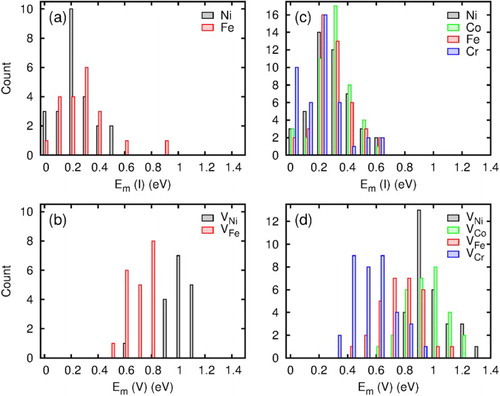
Figure 1. Disorder profiles, extracted using an iterative procedure [Citation41] from the corresponding channeling spectra for Ni, NiFe, and NiFeCoCr single crystals irradiated at 16 K with 500 keV Ar ions at indicated fluences: (a) 1, (b) 3, and (c) 5 nm−2, respectively. The solid lines are curve fits to guide the eye.
![Figure 1. Disorder profiles, extracted using an iterative procedure [Citation41] from the corresponding channeling spectra for Ni, NiFe, and NiFeCoCr single crystals irradiated at 16 K with 500 keV Ar ions at indicated fluences: (a) 1, (b) 3, and (c) 5 nm−2, respectively. The solid lines are curve fits to guide the eye.](/cms/asset/c3ce016f-5110-4e64-b261-e755e5d8ca2c/tmrl_a_1410863_f0001_c.jpg)
Figure 2. Disorder at the damage peak (∼180 nm) as a function of both the Ar-ion fluence (bottom axis) and the dpa value (top axis) for Ni, NiFe, and NiFeCoCr irradiated with 500 keV Ar ions at 16 K. For convenience, Ar fluence is converted in displacements per atom (dpa). The dashed lines are curve fits to guide the eye. For better visibility of all data, part (a) has a logarithmic and (b) a linear scale.
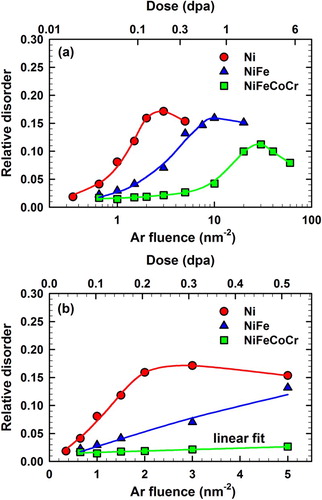
Figure 3. Migration barrier (Em) distribution of interstitials (I) and vacancies (V) in NiFe (left column) and NiCoFeCr (right column).