Figures & data
Figure 1. (a) Experimental setup and dimensions. (b) Simplified 2D model using the plane strain assumption and linear isotropic elastic material.
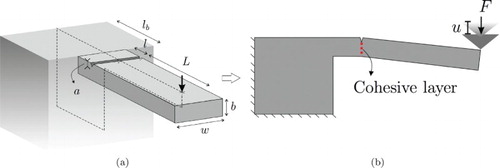
Figure 2. Finite element mesh of the structure as well as the traction-separation law for the CZ. CZ elements are shown in green and elastic solid elements in red.
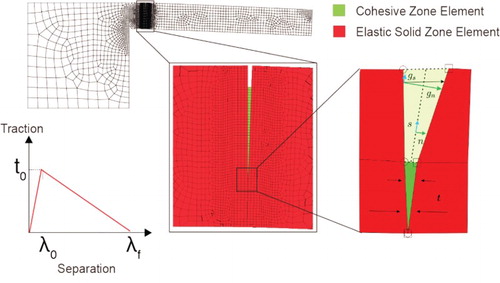
Figure 3. (a) A comparison of the load–displacement curves for a 3D finite element model with no mesh refinement and the result from the 2D model used in this work, showing excellent agreement. (b) Variation of β with GPa,
and
, showing the insensitivity of the model to the shear parameter.
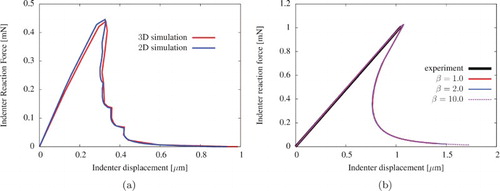
Table 1. Elastic properties of MAlON.
Figure 4. (a) Three stress–strain curves from a beam tested to increasing values of strain. The overlapping curves indicate no plastic deformation nor stable crack growth before fracture occurs. (b) Fracture surface of a TiAlON micro-cantilever. Intercolumnar fracture can be seen running from the FIB-machined notch.
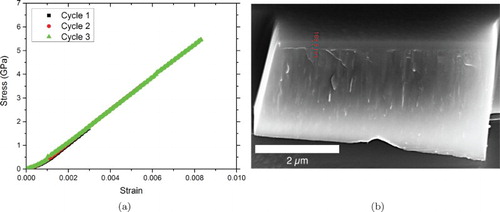
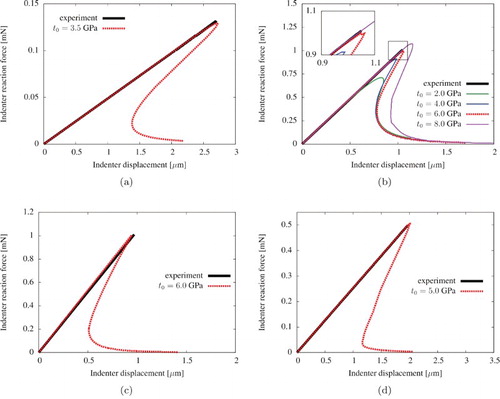
Figure 5. Experimental and simulated load–displacement data for (a) VAlN, (b) VAlON, (c) TiAlN, and (d) TiAlON. Experimental data shown in black, with the variation of for the four materials, with
m,
. The best fit to the experimental data is given by the dashed line. Values of fracture energy are: 27.08, 26.3, 11.17 and
for VAlN, VAlON, TiAlN and TiAlON, respectively. The variation of
is shown for VAlON to demonstrate the sensitivity of this parameter.