Figures & data
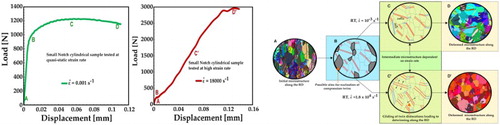
Figure 1. (A) Schematic of the Bridgman notch cylindrical specimens along with the un-notched tension specimen. Mechanical responses for the different notch-geometries along (B) the RD; (C) the TD; and (D) the ND.
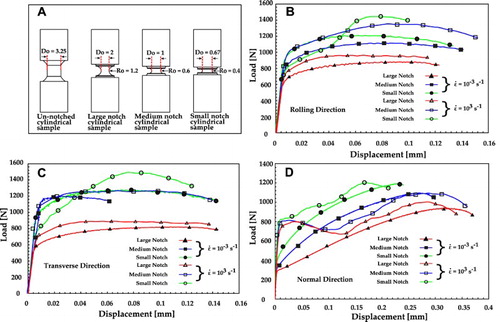
Table 1. Dimensions for different notch-geometries and the corresponding initial stress-triaxiality for each type of notch.
Figure 2. (A) Load-displacement curve for the small-notch cylindrical specimen along the RD at various strain-rates. (B) XRD patterns for the as-received and tested specimens along the RD. Light microscopy images of (C) the as-received sample along the RD; a small-notch cylindrical specimen tested at (D) 10−3 s−1 and (E) 5 × 10³ s−1 along the RD. Note that the XRD pattern of tested sample (B) and the images (D) and (E) were taken just below the fracture surface in the notch sections.
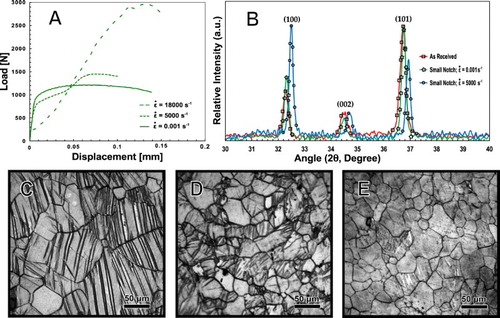
Figure 3. EBSD maps along the RD of (A) as-received sample; (B) sample tested at 103 s−1 in pure uniaxial tension; and small-notch cylindrical specimens tested at (C) 10−3 s−1, (D) 5 × 10³ s−1, and (E) 1.8 × 10⁴ s−1 along the RD. These EBSD maps (B, C, D, and E) were obtained from the area just below the fracture surface in the gauge-sections (notch-root).
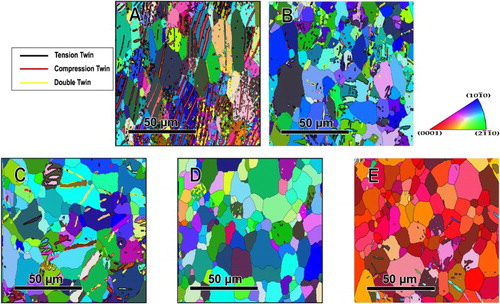
Figure 4. Basal pole figures (0001) along the RD of the (A) as-received sample; (B) the sample tested at 103 s−1 in pure tension; and small-notch cylindrical sample tested at (C) 10−3 s−1, (D) 5 × 10³ s−1, and (E) 1.8 × 10⁴ s−1 strain-rates along the RD.
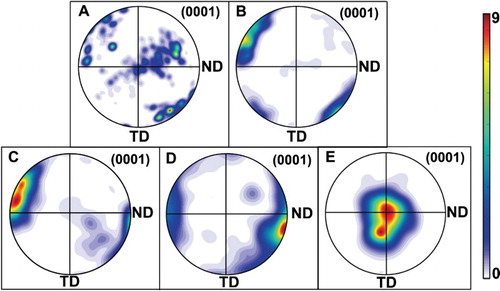
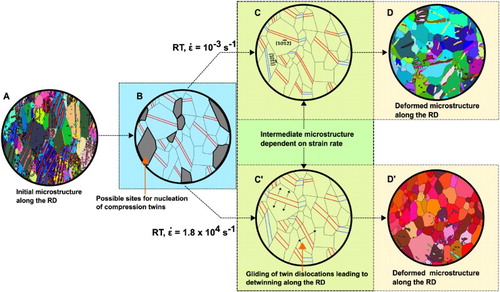
Figure 5. (A) As-received microstructure along the RD; (B) hypothetical microstructure operative in the primary deformation stage, irrespective of strain-rate, as a result of induced stress-triaxiality; hypothetical microstructure operative at the secondary deformation stage as a result of (C) quasi-static and (C) high strain-rates; and deformed microstructure along the RD for the (D) quasi-static and (D
) high strain-rates.