Figures & data
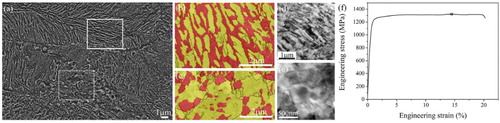
Figure 1. (a) SEM image of present medium Mn steel with dual-phase heterogeneous structure. (b) Magnified view of dashed rectangle in (a). Solid rectangle marks lamella structure; Dashed rectangle marks the granular structure. (c) EBSD phase map showing the lamella ferrite and lamella austenite. Red: ferrite; yellow: austenite. Black line represents high angle boundaries (θ > 15°); white line represents low angle boundaries (2° < θ < 15°). The white arrows mark austenite grains that are fully surrounded by lamella ferrite. (d) The corresponding orientation image. (e) TEM image of lamella structure—α: ferrite; γ: austenite. (f) The width distribution of lamella ferrite and lamella austenite.
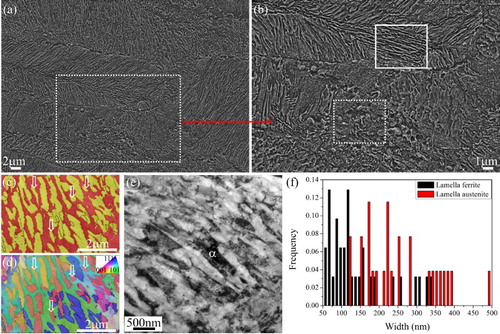
Figure 2. (a) EBSD phase map of granular structure showing the distribution of ferrite both at austenite grain boundaries and within austenite grain interior. Black line represents high angle boundaries (θ > 15°); white line represents low angle boundaries (2° < θ < 15°). (b) The corresponding orientation image. (c) STEM image showing granular ferrite and austenitic matrix. α: ferrite; γ: austenite. Dashed arrow marks the position of TEM-EDS line measurement. White cross marks the position of TEM-EDX spot measurement. (d) The TEM-EDS analysis showing the element partitioning between granular ferrite and austenitic matrix. (e) The grain size distribution of granular ferrite and granular austenite.
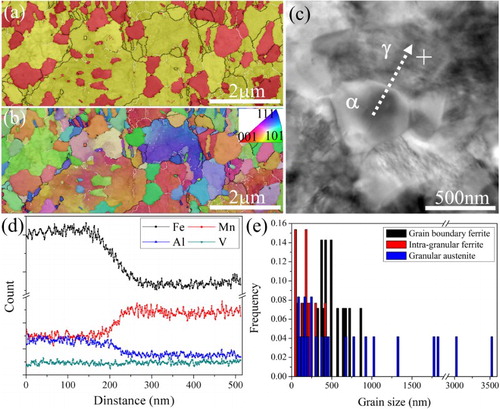
Figure 3. (a) TEM image showing the distribution of dislocations and vanadium carbide precipitates in granular ferrite. The upper inset shows the TEM-EDS spectrum of vanadium carbide precipitates. (b) TEM image showing the distribution of dislocations in lamella ferrite. (c) TEM image showing the small austenite grain. (d) TEM image of large granular austenite grain with high dislocation density. (e) TEM image of large granular austenite grain with dislocation cell structure. (f) TEM image showing the distribution of deformation nanotwins in large granular austenite grains.
Figure 4. Evolution of microstructure in present steel during thermomechanical processing. (a) EBSD phase image of present steel in the hot rolled state. Red: martensite; yellow: austenite. (b) SEM image of WR + IA sample, showing the distribution of granular ferrite grains either at austenite grain boundaries or within austenite grain interior—α: ferrite; γ: austenite. The dashed lines represent the prior austenite grain boundaries. (c) XRD profiles of WR + IA sample prior to and after tensile test, showing the intensive formation of martensite (∼56%) after fracture. (d) The transformation kinetics of fractured WR + IA sample during isothermal holding at 700°C for 600 s.
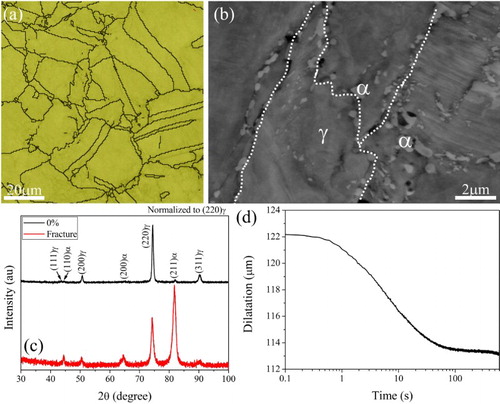
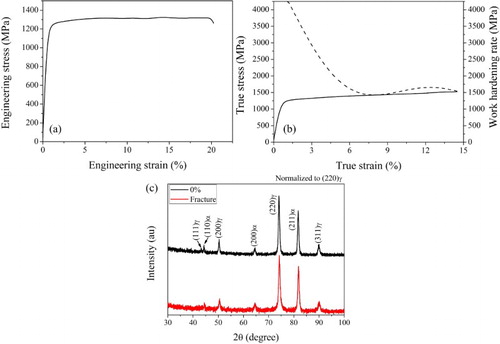
Figure 5. (a) Engineering stress strain curves of our steel with dual-phase heterogeneous structure. Hollow square marks the ultimate tensile strength. (b) The corresponding true stress–strain curve and work-hardening curve. (c) XRD profiles of our steel with dual-phase heterogeneous structure prior to and after tensile test, showing a negligible decrease of austenite volume fraction from 57% down to 55% after fracture. The decreased amount (∼2%) of austenite volume fraction is within the error of XRD measurement (∼5%).