Figures & data
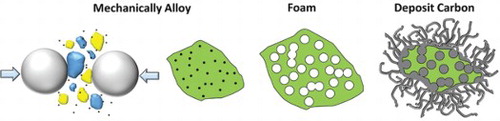
Figure 1. (A) Carbon deposition quantities for each sample after 1 hr under 4:1 C2H4:H2 at listed temperatures, and (B) increase in porosity after 1 hr under 5% H2 (bal. Ar) at listed temperatures.
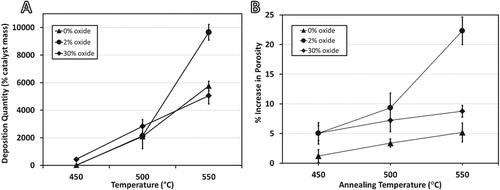
Figure 2 (A) Total carbon deposition and (B) carbon deposition rates measured for samples at reaction times shown. All reactions performed at 550°C under 4:1 C2H4:H2.
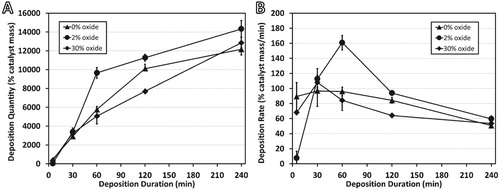
Figure 3. Carbon deposition after 5 min on Ni–Cu catalysts containing (A) 0% oxide, (B) 2% oxide, and (C) 30% oxide. (D) magnified view of boxed area in (C). Reactions conducted at 550°C with 4:1 C2H4:H2.
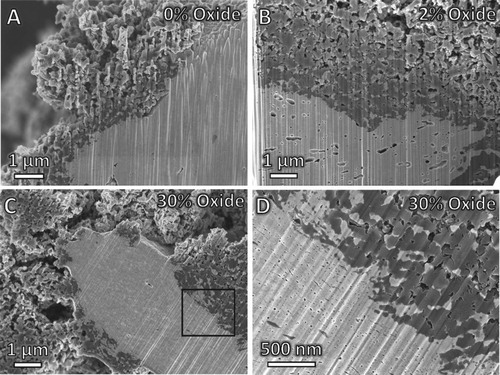
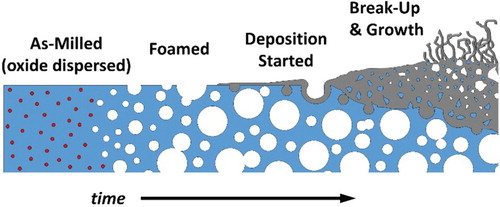
Figure 4. Schematic representation of the multifunctional alloy created through mechanical alloying. A single alloy is designed to serve multiple purposes through in-situ transformation.