
Figures & data
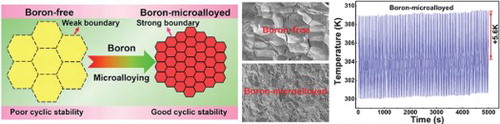
Figure 1. Schematic illustration of the concept for enhancing mechanical properties and cyclic stability of elastocaloric effect in multiferroic phase-transforming alloys.
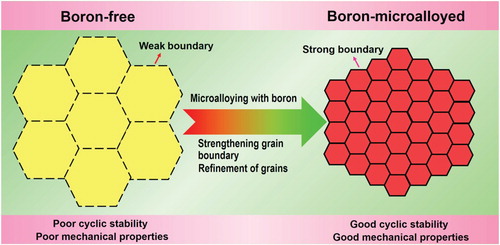
Table 1. Composition, electronic concentration e/a and phase transformation temperatures of the Ni-Mn-In-based alloys.
Figure 2. (a–c) Temperature variation during cyclic loading, holding, and unloading, shown as a function of time for (a) Ni51.5Mn33In15.5, (b) Ni51Mn33In14Fe2 and (c) (Ni51Mn33In14Fe2)99.4B0.6, respectively. The inset of (b) shows the temperature variation during one of the cycles for Ni51Mn33In14Fe2. The maximum applied stress is 350 MPa and the strain rate is 2.8 × 10⁻² s−1. For the results shown in (c), the test was interrupted after each 300 cycles to save the data while the sample temperature was still being monitored during that time period. The testing temperature for (c) is 304 K. The determination of adiabatic temperature change ΔTad is illustrated in (b). (d) Temperature variation recorded during the 300th, 900th, 1500th, 2100th and 2700th cycles of loading, holding, and unloading for (Ni51Mn33In14Fe2)99.4B0.6. (e) Adiabatic stress-strain curve recorded during the 300th cycle of loading, holding, and unloading (with a strain rate of 2.8 × 10⁻² s−1) [the corresponding temperature variation is shown in (d)] and isothermal stress-strain curves with different maximum applied stresses (the strain rate is 2.8 × 10⁻⁴ s−1), for (Ni51Mn33In14Fe2)99.4B0.6.
![Figure 2. (a–c) Temperature variation during cyclic loading, holding, and unloading, shown as a function of time for (a) Ni51.5Mn33In15.5, (b) Ni51Mn33In14Fe2 and (c) (Ni51Mn33In14Fe2)99.4B0.6, respectively. The inset of (b) shows the temperature variation during one of the cycles for Ni51Mn33In14Fe2. The maximum applied stress is 350 MPa and the strain rate is 2.8 × 10⁻² s−1. For the results shown in (c), the test was interrupted after each 300 cycles to save the data while the sample temperature was still being monitored during that time period. The testing temperature for (c) is 304 K. The determination of adiabatic temperature change ΔTad is illustrated in (b). (d) Temperature variation recorded during the 300th, 900th, 1500th, 2100th and 2700th cycles of loading, holding, and unloading for (Ni51Mn33In14Fe2)99.4B0.6. (e) Adiabatic stress-strain curve recorded during the 300th cycle of loading, holding, and unloading (with a strain rate of 2.8 × 10⁻² s−1) [the corresponding temperature variation is shown in (d)] and isothermal stress-strain curves with different maximum applied stresses (the strain rate is 2.8 × 10⁻⁴ s−1), for (Ni51Mn33In14Fe2)99.4B0.6.](/cms/asset/5e7c5d74-541d-4b6b-9fdf-5ba6a7c38248/tmrl_a_1566182_f0002_oc.jpg)
Figure 3. Scanning electron fractographs for the (a) Ni51.5Mn33In15.5, (b) Ni51Mn33In14Fe2, (c) (Ni51.5Mn33In15.5)99.4B0.6 and (d) (Ni51Mn33In14Fe2)99.4B0.6 alloys, respectively.
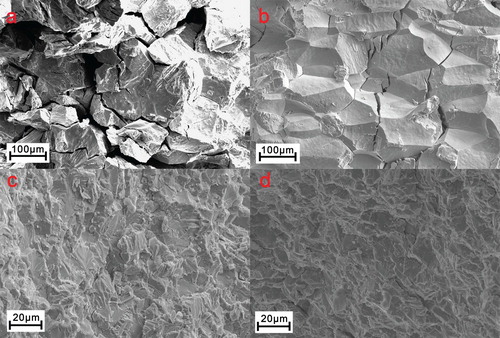
Figure 4. (a) Mass spectrum for the (Ni51Mn33In14Fe2)99.4B0.6 tip specimen taken from a region around the grain boundary (as illustrated in Figure S3d). The inset shows the assignment of the peaks enclosed in the rectangular frame in the main panel; the red vertical lines denote the peak positions of NiBH+. (b) 3D APT reconstructions of atomic distributions of Ni, Mn, In and Fe and distribution of NiBH+ around the grain boundary, together with the iso-concentration surface for NiBH+ at 0.8% (lower right panel).
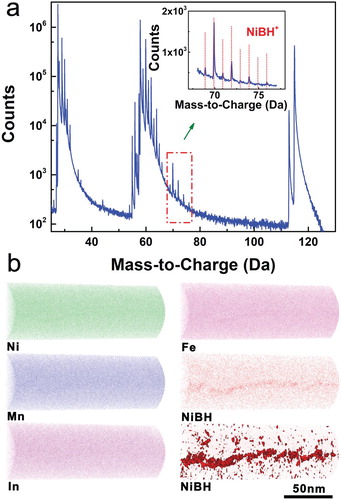
Figure 5. Comparison of the cyclability of elastocaloric effect and adiabatic temperature change ΔTad of the alloys designed in this work with other elastocaloric materials in the polycrystalline form. The ‘Cycles’ denote the number of cycles of elastocaloric effect reported in literature; since most of the studies did not mention whether failure occurred after such cycles, this number does not necessarily corresponds to fatigue life. Data in this figure were taken from the present study and literature: Ti-Ni film [Citation4], Ti-Ni-Cu film [Citation4], Ti-Ni-V [Citation21], Ti-Ni [Citation23], Ni-Mn-In [Citation6], Cu-Zn-Al [Citation5], Ni-Co-Mn-In [Citation16,Citation19], Ni-Mn-Ga [Citation20], Ni-Fe-Ga [Citation22].
![Figure 5. Comparison of the cyclability of elastocaloric effect and adiabatic temperature change ΔTad of the alloys designed in this work with other elastocaloric materials in the polycrystalline form. The ‘Cycles’ denote the number of cycles of elastocaloric effect reported in literature; since most of the studies did not mention whether failure occurred after such cycles, this number does not necessarily corresponds to fatigue life. Data in this figure were taken from the present study and literature: Ti-Ni film [Citation4], Ti-Ni-Cu film [Citation4], Ti-Ni-V [Citation21], Ti-Ni [Citation23], Ni-Mn-In [Citation6], Cu-Zn-Al [Citation5], Ni-Co-Mn-In [Citation16,Citation19], Ni-Mn-Ga [Citation20], Ni-Fe-Ga [Citation22].](/cms/asset/9e303e96-a786-44ea-9de0-ea39f55b79fc/tmrl_a_1566182_f0005_oc.jpg)