Figures & data
Figure 1. (a) APT map displays the atomic-scale elemental distribution. (b) Frequency distribution analysis for Co, Cr, Ni, Al and Ti atoms, which shows a comparison of observed (solid line) and the ideal random distribution (bar) described by binomial distributions for average solute contents.
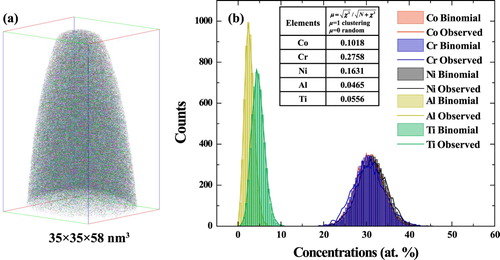
Figure 2. SEM images of the γ′ precipitates in the Al3Ti3 alloy after aging at 800°C for (a) 16 h, (b) 72 h, (c) 168 h and (d) 360 h; The corresponding statistical particle size distribution of the experimental data and the prediction of the LSW model were also shown as insets.
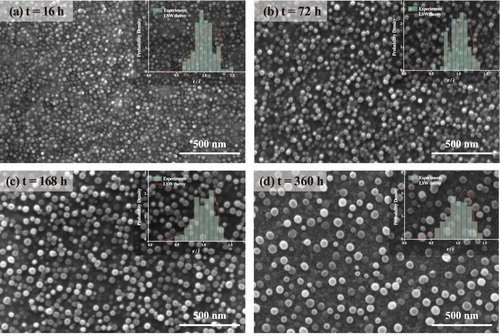
Figure 3. (a) and (b) APT-reconstructions of the Al3Ti3 MEA aged at 800°C for 4 h and 168 h, respectively; (c) Level rule for the calculation of the volume fraction of the γ’ phase.
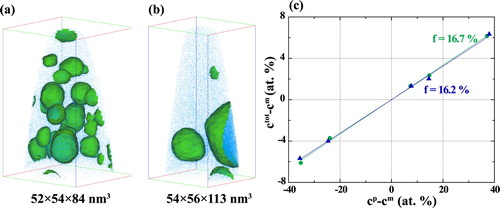
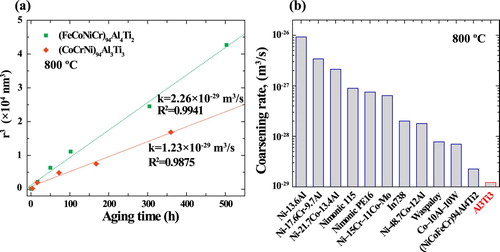
Figure 4. (a) The LSW relationship illustrating the coarsening of the γ’ phase in the Al3Ti3 MEA and the reported (FeCoNiCr)94Al4Ti2 MEA. (b) Comparison of coarsening rates for the Al3Ti3 MEA and a number of Ni-based superalloys at 800°C.