Figures & data
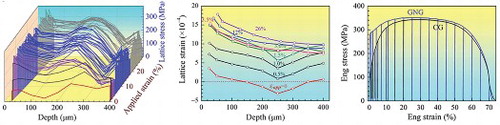
Figure 1. Microstructure and microhardness in a gradient structured (GS) IF steel sample processed by SMAT. a, Cross-sectional morphology of the GS sample, with nanograined (NG) surface layer and central CG layer. b, Microhardness (HV) distribution along the depth. c, Size distribution of grain, subgrain and defect structures along the depth. The features of dislocation sub-structures are shown in d–f, Cross-sectional TEM micrographs showing varying slip-bands, dislocation cells and subgrains at the depth of ∼ 350, 300 and 230 μm, respectively.
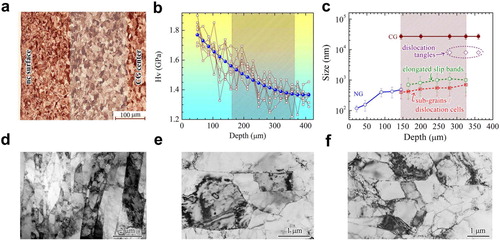
Figure 2. Experimental results as measured by in-situ XRD synchrotron tensile loading. a, Residual stress distribution below the surface prior to tensile loading. b, Variation of the axial lattice strain along the depth at varying applied tensile strain, c and d, Variations of axial stress and FWHM of diffraction peaks (dislocation density) with applied strain along the depth.
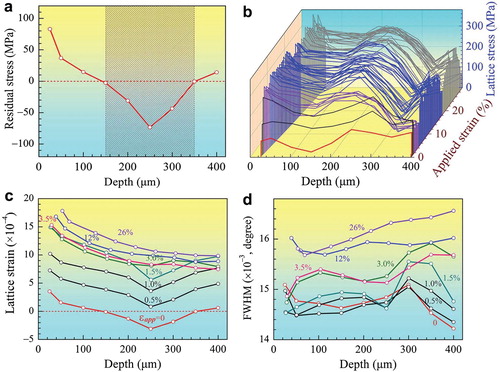
Figure 3. TEM observations of dislocation sub-structure evolutions. a and b, Increase in dislocation entanglement, especially at/near grain boundaries at ∼250 and 300 μm deep from top surface and at applied tensile strain of 3%. Also note dislocations in grain interior. c, Dislocations in grains at ∼250 μm deep from top surface and at applied strain of 15%.

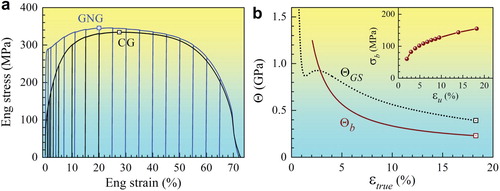
Figure 4. Superior synergistic effect between yield strength and ductility in the GS sample. a, Engineering stress–strain curves of the GS and CG samples. The symbol § indicates uniform elongation. b, Strain hardening rate versus applied strain. Inset: Back stress versus strain.